Data Analytics Using Python
Python offers a wide range of libraries like NumPy, Pandas, and Matplotlib to enable data ingestion, exploration, manipulation, and visualization.
Join the DZone community and get the full member experience.
Join For FreeBusiness Intelligence and Analytics entails data collection, exploration, transformation, and analysis to help businesses make data-driven decisions. BI leverages technologies, applications, and best practices to analyze transactional data and derive business insights to facilitate transformational outcomes.
Python has emerged as a powerful tool within the field of data analytics led by the extensive libraries for data ingestion, analysis, manipulation, and visualization. It offers vast data integration capabilities enabling data ingestion from heterogeneous data sources.
Key Data Analytics Libraries
- statsmodels: Focuses on building estimations, statistical modeling for machine learning, and using an extensive set of classes and functions
- NumPy and SciPy: Both of these libraries provide multi-dimensional array objects for mathematical and scientific calculations.
- Pandas: Pandas is widely used by data scientists for data analysis and manipulation of structured data.
- Matplotlib: Matplotlib offers a strong suite of visualization capabilities to create interactive data visualization.
In this article, I will focus on using Pandas, NumPy, and Matplotlib to analyze a sales inquiry coming into a demand center. I will use a CSV file as an input for this analysis.
Data Exploration
In this section, we will import the CSV file containing the input data and explore the structure of the file.
import numpy as nmp
import pandas as pds
import matplotlib.pyplot as pplt
demand = pds.read_csv('DemandGen.csv')
demand.head()
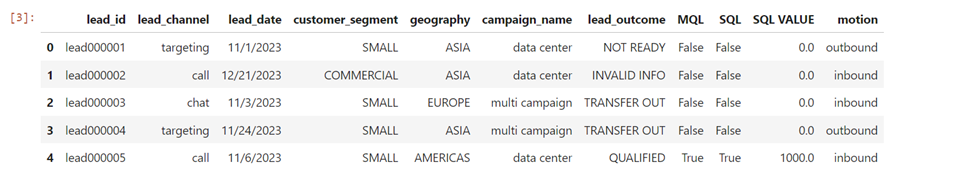
The info() function can be used to describe the input data frame. This will list the column name, number of values, and data types for all the columns in the DataFrame.
demand.info()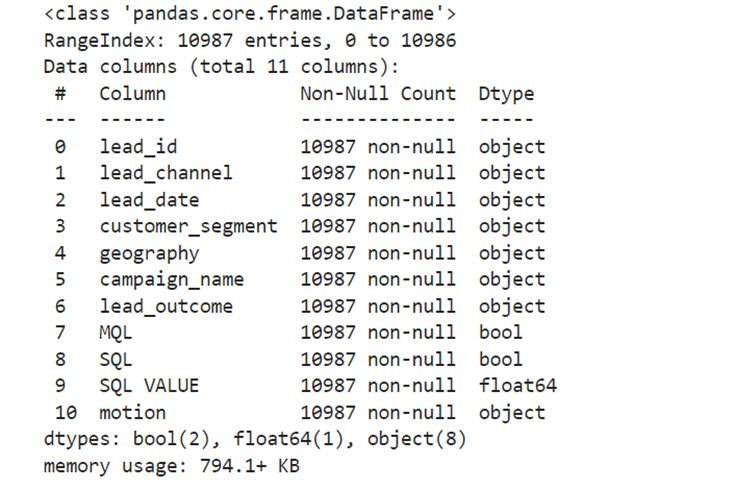
The following code block will print the range of lead dates as well as number of marketing-qualified and sales-qualified leads.
print('lead_date ranges from', demand.lead_date.min(), 'to', demand.lead_date.max())

print('number of marketing qualified leads',demand[demand['MQL'] == True]['lead_id'].nunique())

print('number of sales qualified leads',demand[demand['SQL'] == True]['lead_id'].nunique())
Data Transformation and Visualization
In this section, let’s explore the Python capabilities surrounding data transformation, creating calculated columns, changing the data types, and data visualization.
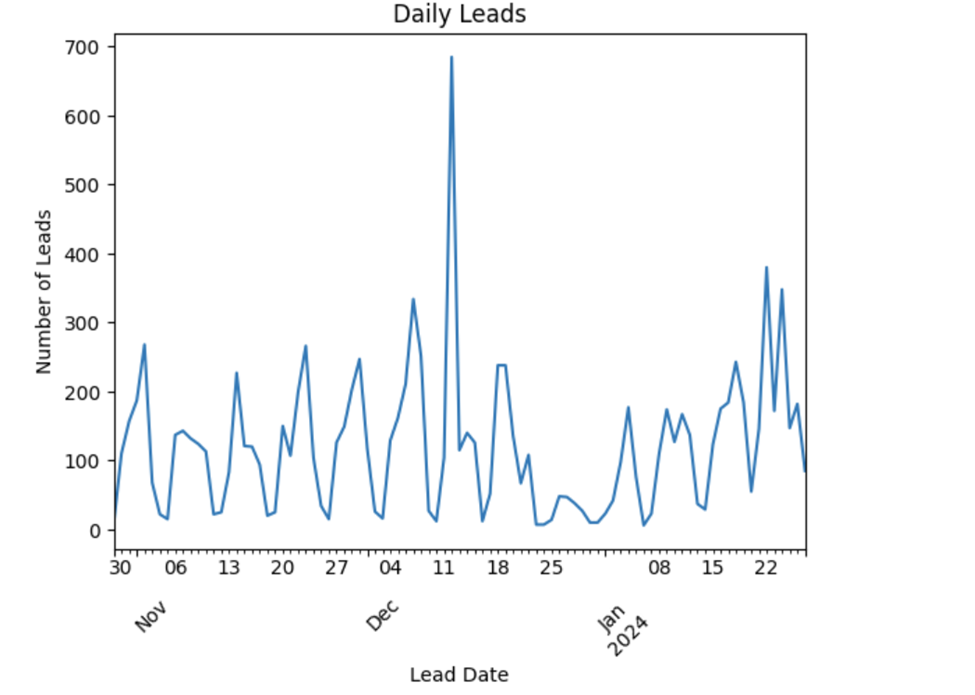
Number of Leads by Lead Date
The code below will create a line chart to track the number of leads the demand center has received by the dates.
#convert the lead date into datetime
demand.lead_date = pds.to_datetime(demand['lead_date'])
demand['DoW'] = demand['lead_date'].dt.dayofweek
daily_leads = demand.groupby(['lead_date'])['lead_id'].nunique()
# plot daily leads
daily_leads.plot()
pplt.title('Daily Leads')
pplt.xlabel('Lead Date')
pplt.ylabel('Number of Leads')
pplt.xticks(rotation=45)
pplt.show()
Conversion Rates by Lead Channel
The following code can be used to calculate the conversion rate from a lead to a Marketing Qualified Lead. This code block will create a bar chart to visualize the conversion rate by the channel.
total = demand.groupby(['lead_channel'])['lead_id'].nunique()
MarketingQualifiedLead = demand[demand['MQL'] == True].groupby(['lead_channel'])['lead_id'].nunique()

# Calculate conversion rate
channel_conversion_rate = MarketingQualifiedLead/total
print(round(channel_conversion_rate*100,2), '%')

channel_conversion_rate.plot(kind='bar')

pplt.title('Conversion rate by Channel\n', size = 16)
pplt.xlabel('Channel', size = 14)
pplt.ylabel('Conversion rate (%)', size = 14)
pplt.show()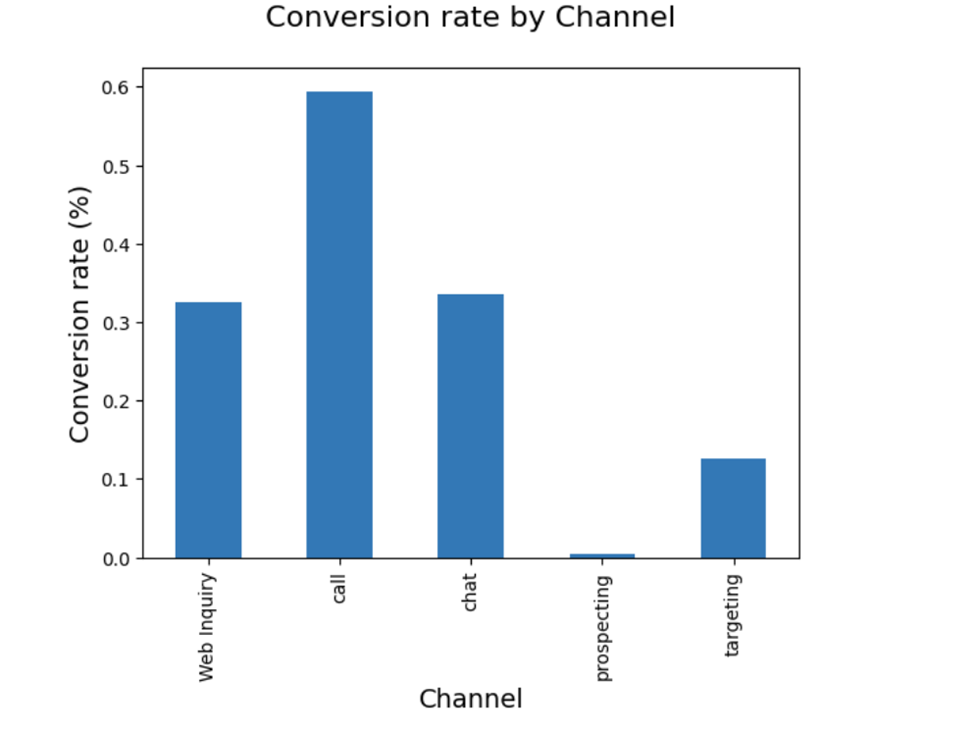
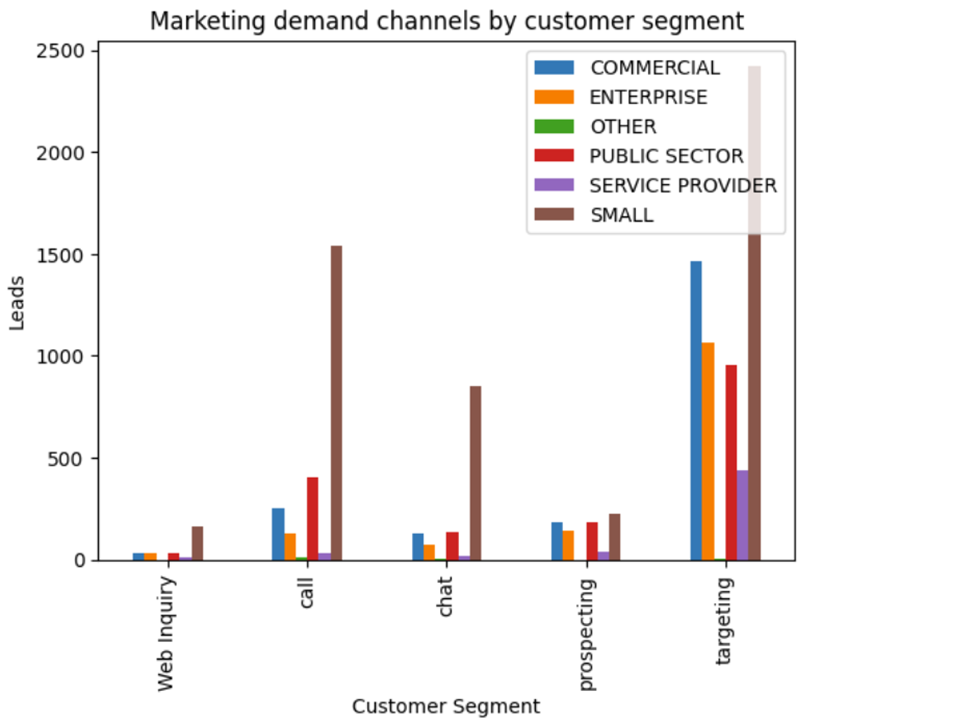
Number of Leads by the Customer Segment for Each Lead Channel
The following code will create a bar chart to visualize the number of leads received by the demand channel for various segments.
channel_segment = demand.groupby(['lead_channel', 'customer_segment'])['lead_id'].count()

channel_segment_df = pds.DataFrame(channel_segment.unstack(level = 1))

channel_segment_df.plot(kind = 'bar')

pplt.title('Marketing demand channels by customer segment')
pplt.xlabel('Customer Segment')
pplt.ylabel('Leads')
pplt.legend(loc = 'upper right', labels = channel_segment_df.columns.values)
pplt.show()
User Defined Functions
Automating the Conversion Calculation
Python allows you to create a user-defined function to execute the set of statements based on the input parameters. The code below creates a function to calculate the MQL conversion based on input parameters.
# MQL Conversion rate
def mql_conversion_rate(df, column_names):
    column_mql_conv = df[df['SQL'] == True] \
                       .groupby(column_names)['lead_id'].nunique()

    # Total number leads
    column_total = df.groupby(column_names)['lead_id'].nunique()

    # MQL Conversion rate
    conversion_rate = column_ mql_conv/column_total

    # Fill missing values with 0
    conversion_rate = conversion_rate.fillna(0)
    return conversion_rate

# Calculate conversion rate by lead date and customer segment
customer_segment_conv = conversion_rate(demand, ['lead_date',
                                             'customer_segment'])

customer_segment_df = pds.df(customer_segment_conv.unstack(level = 1))

# Visualize conversion by age_group
customer_segment_df.plot()
pplt.title('Conversion rate by customer segment\n', size = 16)
pplt.ylabel('Conversion rate', size = 14)
pplt.xlabel('Customer Segment', size = 14)
pplt.show()

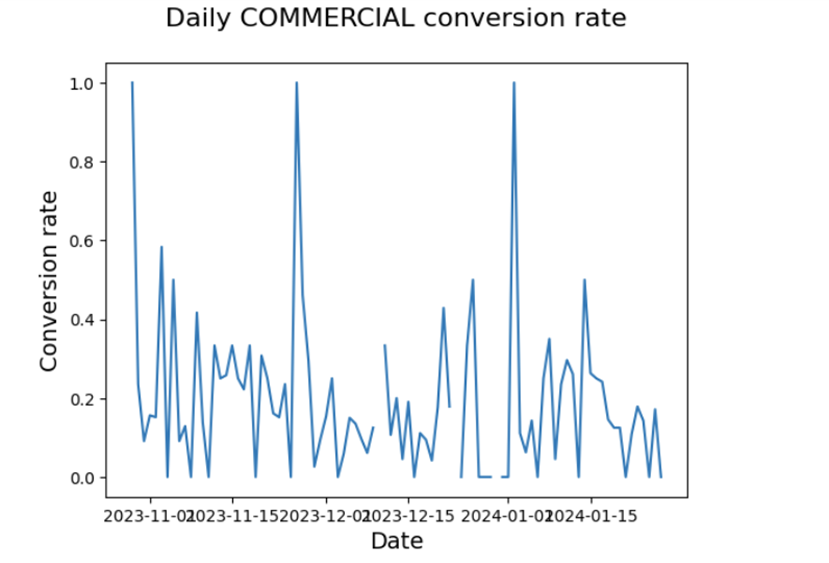
Visualization Function
The following code creates a function to plot a line chart based on the input data frame.
# Plotting function
def plotting_conv(df):
    for column in df:
        pplt.plot(df.index, df[column])
        pplt.title('Daily ' + str(column) + ' conversion rate\n',
                  size = 16)
        pplt.ylabel('MQL Conversion rate', size = 14)
        pplt.xlabel('Date', size = 14)
        pplt.show()
        pplt.clf()
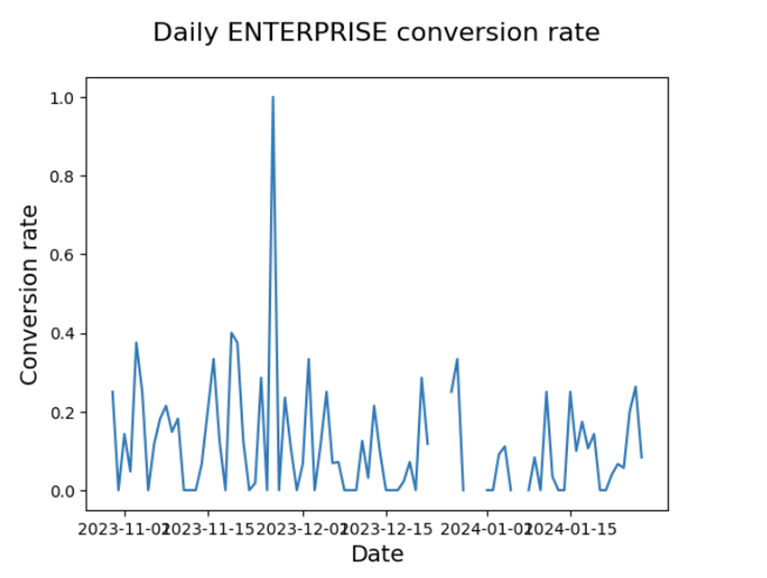
Below, the code invokes the plotting function to create individual line charts for each customer segment.
%matplotlib inline
# Calculate conversion rate by lead date and customer segment
customer_segment_conv = conversion_rate(demand,
                                 ['lead_date', 'customer_segment'])

# Unstack customer_segment_conv and create a DataFrame
customer_segment_df = pds.DataFrame(customer_segment_conv.unstack(level=1))

# Plot the results
plotting_conv(customer_segment_df)
Conclusion
In conclusion, Python offers a robust data analytics framework using libraries like NumPy, Pandas, and Matplotlib. These libraries are widely used by the Business Intelligence and Data Analytics community for data exploration, manipulation, statistical analysis, and data visualization. As the analytics landscape continues to evolve, I would recommend continued learning of SciPy, Statsmodels, and Scikit-learn to implement AI/ML applications.
Opinions expressed by DZone contributors are their own.
Comments