Decoding Data Analysis: Transforming Cross-Tabulation Into Structured Tabular Tables
In this tutorial, we will explain how to convert cross-tabulation into structured tabular data, which allows for enhanced analysis and insights.
Join the DZone community and get the full member experience.
Join For FreeLooking at the two tables below, which format do you find more intuitive and easier to read?
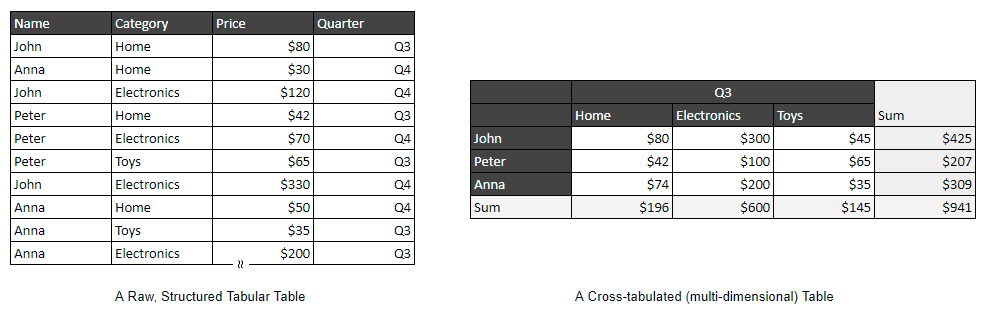
For years, people have been using spreadsheet software to create cross-tabulated (or contingency, multi-dimensional) reports or fill forms. These reports neatly organize categories, dates, and other data points into levels of rows and columns, making them easy to read and analyze.
However, each report represents just one viewpoint of the underlying data, such as the total sales revenue of each salesman in each quarter of the year. In order to show another viewpoint of the collected data (e.g., the average sales revenue of each quarter for each salesman in the year 2023), we then have to create a new report or fill the form from scratch with spreadsheet software again, which is tedious and error-prone.
The Pivot Table Solution
To address the limitations of static cross-tabulated reports, software engineer Pito Salas introduced the pivot table concept in 1989 with Lotus Improv. Pivot tables allow users to dynamically restructure data, allowing them to easily view reports from different angles.
Prerequisites for Pivot Tables
However, using pivot tables requires a well-structured tabular-style source data model, which can be challenging for general users. Unlike creating cross-tabulated reports, designing such a data model demands engineering training and can be time-consuming and complex.
Unpivoting the Cross-Tabulated Table
To unlock the full potential of cross-tabulated data, we need a way to rapidly analyze existing cross-tabulated reports and convert them into structured tabular-style data models for further analysis. This process, known as "unpivoting," involves splitting the cross-tabulation into different parts and then reorganizing them into a structured format.
By identifying and organizing the side labels, top labels, and numbers, we can create a structured tabular-style data model that represents the original cross-tabulation in a more flexible format.
A Step-by-Step Transformation Example
Consider a simple example: an ad hoc spreadsheet-made cross-tabulation report for student scores is laid out like the following.
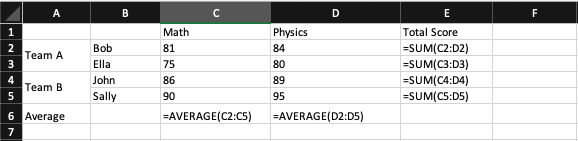
With students being split into two teams on the left columns and subjects on the top row, the central cross matrix area is the corresponding scores of the subject for each student. On the right end columns, column E, are formulas for the total score of each student. On the bottom row (row 6) is the formula for the average score for all students for each subject.
To convert the above cross-tabulation rectilinear displayed report into a corresponding structured tabular-style source data model, we have to split cross-tabulation into three parts first, i.e., the side labels, top labels, and numbers.
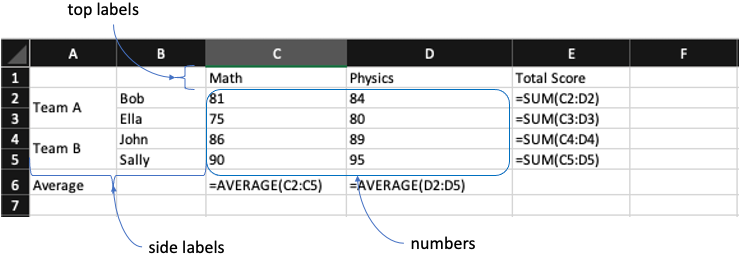
Each level of the side labels and top labels corresponds to a field of the resolved structured tabular-style data model. The number itself is also a field of the structured tabular-style data model.
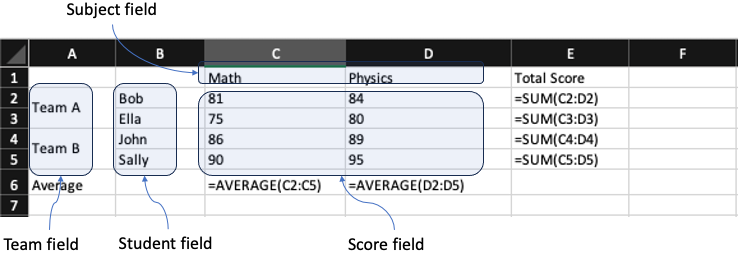
As the above example cross-tabulation, there is a “Team” field(column A) for “Team A” and “Team B,” a “Student” field(column B) for “Bob,” “Ella,” “John,” and “Sally,” a “Subject” field(row 1) for “Math” and “Physics,” and the “Score” field(area C2:D5) for each corresponding number for each associated student and subject; as shown in the following resolved tabular-style data model:

Note that each number is uniquely associated with a combination of side labels and top labels, so it is most important to identify the number area first. As long as we identify the number area, the side label areas (to the left of the number area) and top label areas (to the top of the number area) are easily identified.
Identifying the Number Area
To identify the number area, the most direct way is to scan reports row by row and pick those cells with numbers, then union such cells into areas. As in the example, we can immediately know that the number area is C2:D5. But for complex reports, there might be other numbers scattered around, making it difficult to identify the real concerned number area.
Another way is to utilize the information provided by summary formulas. People write aggregation formulas in reports such as SUM or AVERAGE to summarize real numbers of concern, and we can use such information to locate the number area. In the example cross-tabulation report, in column E, we saw four SUM formulas that reference C2:D2, C3:D3, C4:D4, and C5:D5, which union into C2:D5 helping us to identify the number area. In row 6, we saw two AVERAGE formulas that reference C2:C5 and D2:D5, which combine into C2:D5, which allows us to identify the number area again.
Identifying the Label Area
After we get the number area, just scan column by column from the left border of the number area until there is no column or empty column to find the side labels; scan row by row from the top border of the number area until no row or empty row to find the top labels.
Dealing With Multi-Level Labels
The side labels and/or top labels might be in multiple levels. They each naturally form a group tree from higher level to lower level. Each level is a field for the resolved tabular-style data model. For, the side labels in the example form a group tree like the following:
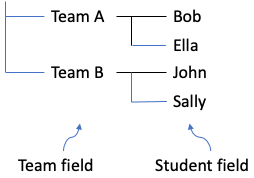
And top labels (with only one level in the example) form a group tree like the following:

Then we combine and expand two trees into one master tree and append the corresponding number to the path of each side labels plus top labels combinations, as shown below:
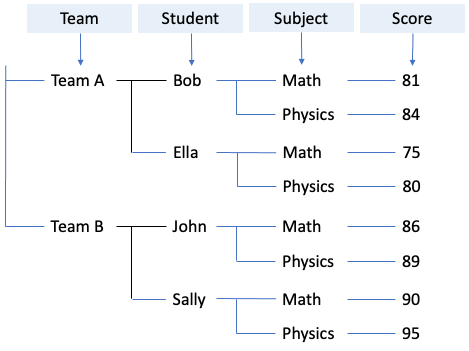
Note that each level of the trees is associated with a field in the resolved tabular-style data model. Now, we simply traverse the tree from root to leaf and fill in the value in each associated field:
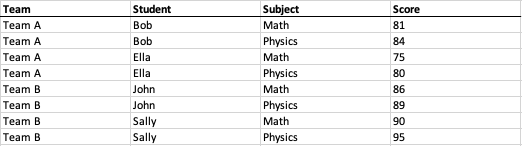
At this point, we've converted a cross-tabulation into a raw, structured tabular format.
I'm excited to share this article as I've been exploring various data analysis techniques for my project, ottava.io. We've recently implemented this unpivoting technique that I believe could be helpful for other developers, too.
By incorporating this method into our platform, ottava.io aims to simplify data analysis and manipulation, eliminating the need for manual data preparation or reliance on advanced tools like Power Query or Python Pandas. Our goal is to streamline the process and empower users to delve deeper into their data to uncover valuable insights. Your feedback and input on this approach are most welcome.
Opinions expressed by DZone contributors are their own.
Comments