Externalize CloudHub Logs to ELK
Log Externalization is a process to send logs to third-party systems which provides more flexibility to prepare various custom dashboards and visualizations.
Join the DZone community and get the full member experience.
Join For FreeWhat Is Log Externalization?
Log Externalization is a process to send logs to third-party systems like ELK, Splunk, New Relic, etc which provides more flexibility to prepare various custom dashboards and visualizations.
Why Log Externalization Is Required
Sometimes, the out-of-the-box logging and monitoring features of a product or platform are not sufficient or flexible enough to prepare custom dashboard indicators/visualization.
Also, based on the CloudHub license, the size of log retention is limited for a particular period which can vary for different CloudHub licenses. In such cases, we often face the problem of log rotation that imposes a major hurdle while incidence/defect triaging.
These are the major factors that drive the need to externalize application logs to a robust and more reliable logging system like ELK.
ELK Stack
Elasticsearch, Logstash, and Kibana is a powerful open-source solution for log management and analysis.
Logstash is mainly used for processing raw log events which can be used by Kibana to prepare various visualizations. Logstash is compatible with various source systems including CloudHub, and it enables seamless ingestion of log data into Elasticsearch.
Elasticsearch serves as a database that holds all processed log events in NoSQL-document format.
Kibana provides a GUI for exploring, visualizing, and analyzing log data through customizable dashboards and visualizations.
Together, the ELK stack offers organizations a robust and flexible solution for log aggregation, analysis, and visualization.
Architecture Design
The proposed architecture for externalizing logs from CloudHub to the ELK stack is shown in the figure below.
Installing and Configuring Elasticsearch, Logstash, and Kibana
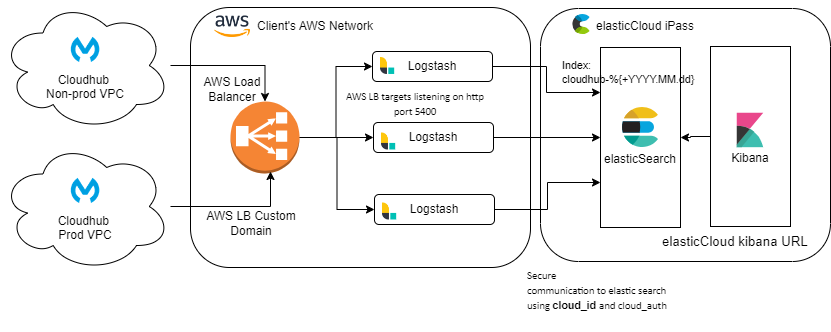
This architecture would work with any deployment platform of ELK, be it on-prem (customer-hosted servers on any hyper-scaler’s compute server) or on bare mettle server, or infrastructure services provided by the elastic Cloud team.
Here, we have used the Elastic Cloud services for Elasticsearch and Kibana.
Please note that Logstash is not included on Elastic Cloud platform and hence we had to deploy our instances of Logstash on AWS EC2 instances.
We have used an array of three Logstash servers running behind an AWS load balancer to tackle the incoming load from our hundreds of APIs running on four different Environments.
Configuring log4j2.xml and Logstash Input Plugins To Ingest Logs From Cloudhub
We want the logs to be sent from each CloudHub API to Logstash on a secure channel.
Here, we would be using the HTTP appender plugin in log4j2.xml to post log events to Logstash.
<Http name="ELK" url="https://${sys:elkHost}:${sys:elkPort}">
            <Property name="Content-Type" value="application/json" />
            <PatternLayout pattern="%m%n"/>
            <SSL>
                   <trustStore location="${sys:logstash.trustStore}" password="${sys:jks.password}"/>
            </SSL>
            <JsonLayout properties="true"/>
</Http>
As per our architecture, we would be using custom domain for AWS load balancer as “elkHost” and 443 as “elkPort”.
We can add the trsutStore created from SSL certificate of AWS load balancer in package explorer under src/main/resources and reference the trsutStore name as “logstash.trustStore” and its associated pass word as “jks.password”.
(I’ll cover a separate topic for custom domain and SSL certificate).
Also, most importantly, MuleSoft cloudhub will only start to send logs external source once “Disable Cloudhub logs” checkbox is checked, and this will stop the logs to be printed in cloudhub.
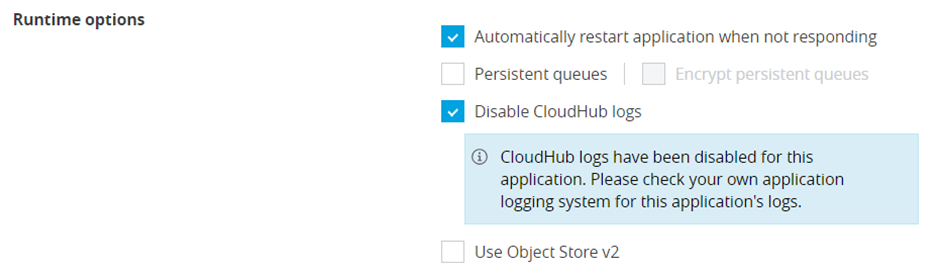
To compensate this and have logs in ELK as well as cloudhub, we can add a cloudhub appender.
<Log4J2CloudhubLogAppender name="CLOUDHUB" addressProvider="com.mulesoft.ch.logging.DefaultAggregatorAddressProvider" applicationContext="com.mulesoft.ch.logging.DefaultApplicationContext" appendRetryIntervalMs="${sys:logging.appendRetryInterval}" appendMaxAttempts="${sys:logging.appendMaxAttempts}" batchSendIntervalMs="${sys:logging.batchSendInterval}" batchMaxRecords="${sys:logging.batchMaxRecords}" memBufferMaxSize="${sys:logging.memBufferMaxSize}" journalMaxWriteBatchSize="${sys:logging.journalMaxBatchSize}" journalMaxFileSize="${sys:logging.journalMaxFileSize}" clientMaxPacketSize="${sys:logging.clientMaxPacketSize}" clientConnectTimeoutMs="${sys:logging.clientConnectTimeout}" clientSocketTimeoutMs="${sys:logging.clientSocketTimeout}" serverAddressPollIntervalMs="${sys:logging.serverAddressPollInterval}" serverHeartbeatSendIntervalMs="${sys:logging.serverHeartbeatSendIntervalMs}" statisticsPrintIntervalMs="${sys:logging.statisticsPrintIntervalMs}">And make sure that both appender are referenced in async root element.
<AsyncRoot level="INFO">
            <AppenderRef ref="ELK"/>
            <AppenderRef ref="CLOUDHUB"/>
</AsyncRoot>
We can change the log level by updating the “level” field here to DEBUG or WARN.
On Logstash side, we are using a http input plugin of Logstash to accept log events on port #5400 (any port can be configured)
It is recommended to secure this input using Secure SSL certificate.
(I’ll cover a separate topic for custom domain and SSL certificate).
input {
  http {
                       port => 5400
                       ssl_enabled => true
                       ssl_certificate_authorities => ["/etc/<bundle certificate>.crt"]
                       ssl_certificate => "/etc/<customDomianCertificate>.crt"
                       ssl_key => "/etc/<customeDomainKey>.key"
                       ssl_client_authentication => "required"
            }
}
Logstash service restart is needed for any changes to be effective.
Defining Logstash Filters to Parse and Enrich Log Events
Depending on your logging framework, you can build this Logstash filter.
I’ll explain few filters.
- Only accept POST method requests to Logstash, rest api log requests would be silently dropped by Logstash.
if [http][method] != "POST" {
                drop {}
}- Prevent fields under payload to be generated as separate log fields
if [logData] {
                mutate {
                        remove_field => ["[logData][executionData][payload]"]
       }
}- Remove unnecessary fields.
mutate {
        remove_field => [
                "[parsedMsg]", "[host]", "[log]", "[agent]", "[date]", "[time]", "[event]", "[parsed_data]", "[msg]"
        ]
}- Convert logTimeStamp to a string value.
mutate {
                convert => {
                "[logTimeStamp]" => "string"
                 }
   }
Mapping CloudHub Log Data to Elasticsearch Indices for Efficient Storage and Retrieval
After processing the logs, Logstash sends the processed logs to Elastic search for storage on an index.
We can keep the index as dynamic such that we can evenly distribute the logs on multiple indexes and do not overwhelm a single index.
Here, in our example, we would be automatically generating a new index on daily basis with a suffix of current date in the index name.
Hence, configure the output section of Logstash as shown below.
output {
  elasticsearch {
        cloud_id => "<cloud_id of your elasticCloud ES instance>"
        cloud_auth => "<username> : <password>"
        index => "cloudhub-%{+YYYY.MM.dd}"
  }
}
Please note that, a user needs to be created in elastic Cloud with proper privileges to create new index and post logs to elastic search.
Configuring Kibana To Create Visualizations, Dashboards, and Alerts Based on Log Data
Once the logs start to flow towards elastic search, we can create data view in Kibana to view and query the logs.
- Under the discover screen of Kibana, click on “create a data view” link
- Provide a name to the data view
- Provide an index pattern that can filter all eligible indexes, i.e.: “cloudhub-*”
- Click on “save data view to Kibana” button.
![create data view]()
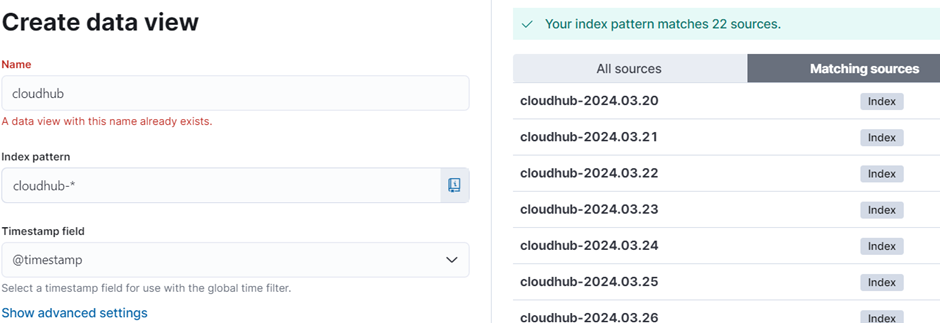
Once data view is created, we can view the logs in Discover screens and perform searches.
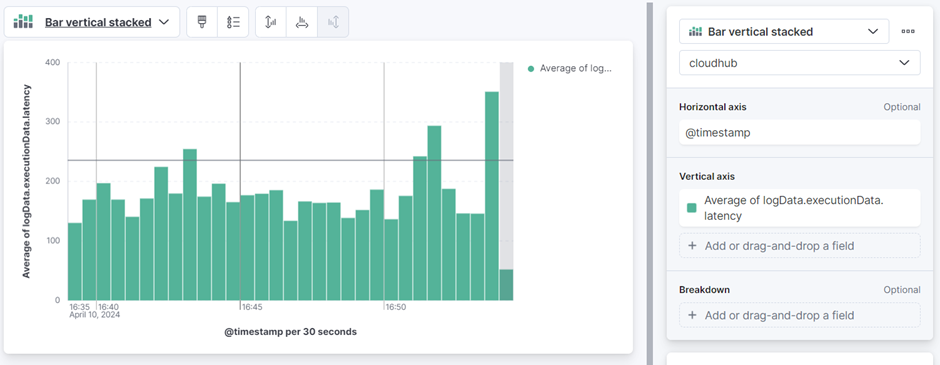
Using the same data view, we can now create multiple dashboards having multiple indicators as per our business needs.
- Goto dashboard
- Click on create visualization.
- Select type of chart
- Select data view - Cloudhub.
- Select the values to be shown on x-axis.
- Select the values to be shown on y-axis.
![bar vertical stacked]()
Best Practices
- Continuous optimizing Logstash pipeline configuration for removing junk log event and apply some business-related rules, for example masking of personal information like SSN and DOB before ingesting in Elasticsearch.
- End to end security of log data in transit and at rest using TLS encryption and access controls.
- Implementing index template and index lifecycle management to manage log data storage for a particular period.
- Monitoring and fine-tuning Elasticsearch cluster based on the performance.
- Implement auto-scaling.
Published at DZone with permission of kashyap kapadia. See the original article here.
Opinions expressed by DZone contributors are their own.
Comments