From CPU to Memory: Techniques for Tracking Resource Consumption Over Time
Atop is a powerful tool for system performance monitoring and analysis. It provides detailed information on system activity. Learn more!
Join the DZone community and get the full member experience.
Join For FreeSometimes, it is necessary to examine the behavior of a system to determine which process has utilized its resources, such as memory or CPU time. These resources are often scarce and may not be easily replenished, making it important for the system to record its status in a file. By doing so, it becomes feasible to identify the most resource-intensive process in the past. If the system has not encountered an Out-of-Memory (OOM) killer, which can be found in the syslog, this information can be used to further pinpoint the problematic process.
Atop Tool: An Overview
There is a special tool that can be used both for real-time monitoring system usage and collecting system status into logs in the background. This is atop. With atop, you can gather information on CPU and memory usage, which can also be collected by other popular monitoring tools like top and htop. Additionally, atop provides insights into I/O and network usage, eliminating the need to install additional tools for network and I/O monitoring, such as iftop and iostat. In my opinion, atop is a versatile tool for many tasks.
Atop is an open-source project and is available for most Linux distributions.
What Is Atop Used For?
Atop can be used for incident investigations in a Linux environment. Atop is a system resource monitor that can provide detailed information about system activity, including CPU, memory, and disk usage, as well as process-level activity
During an incident investigation, atop can help you identify which processes were running at the time of the incident, how many resources they were consuming, and whether there were any spikes in resource usage that may have contributed to the incident. You can also use atop to monitor specific system components, such as network activity, and track changes over time.
Basic use cases are listed below:
- Real-time resources monitoring
- Incidents analysis of the system behavior
- Capacity planning
- Resource allocation
For most of the cases in the list, you can use modern monitoring systems like Zabbix and Prometheus.
In my personal experience, I find atop to be a useful tool for troubleshooting and identifying the root cause of issues. While special monitoring systems can provide consolidated data on resource usage, they may not be able to answer specific questions about which processes led to server inaccessibility. Atop, on the other hand, can provide detailed information on individual processes, making it easier to differentiate between them and understand their impact on system performance.
General principles working with atop:
- Real-time monitoring
- Incident investigation
The first approach can be helpful for debugging or profiling your application, providing insights into its behavior and performance. On the other hand, the second approach is more useful for incident investigations, allowing you to identify the root cause of system failures or performance issues.
Setting Up
For writing logs, you should launch a demon:
# systemctl start atopIt is recommended to change the interval for collecting data:
# vi /lib/systemd/system/atop.serviceYou can find the env variable:
LOGINTERVAL=60Change this value (in seconds) and reload the systemd unit configuration:
# daemon-reloadThen start:
# systemctl start atopAfter that, atop will write info into a log file every 60 seconds (as above).
Real-Time Monitoring Practical Examples
Launching
1. To launch the utility type:
# atopIn a terminal and track resource consumption:
2. In order to change the interval, press 'I' and enter the number in seconds:
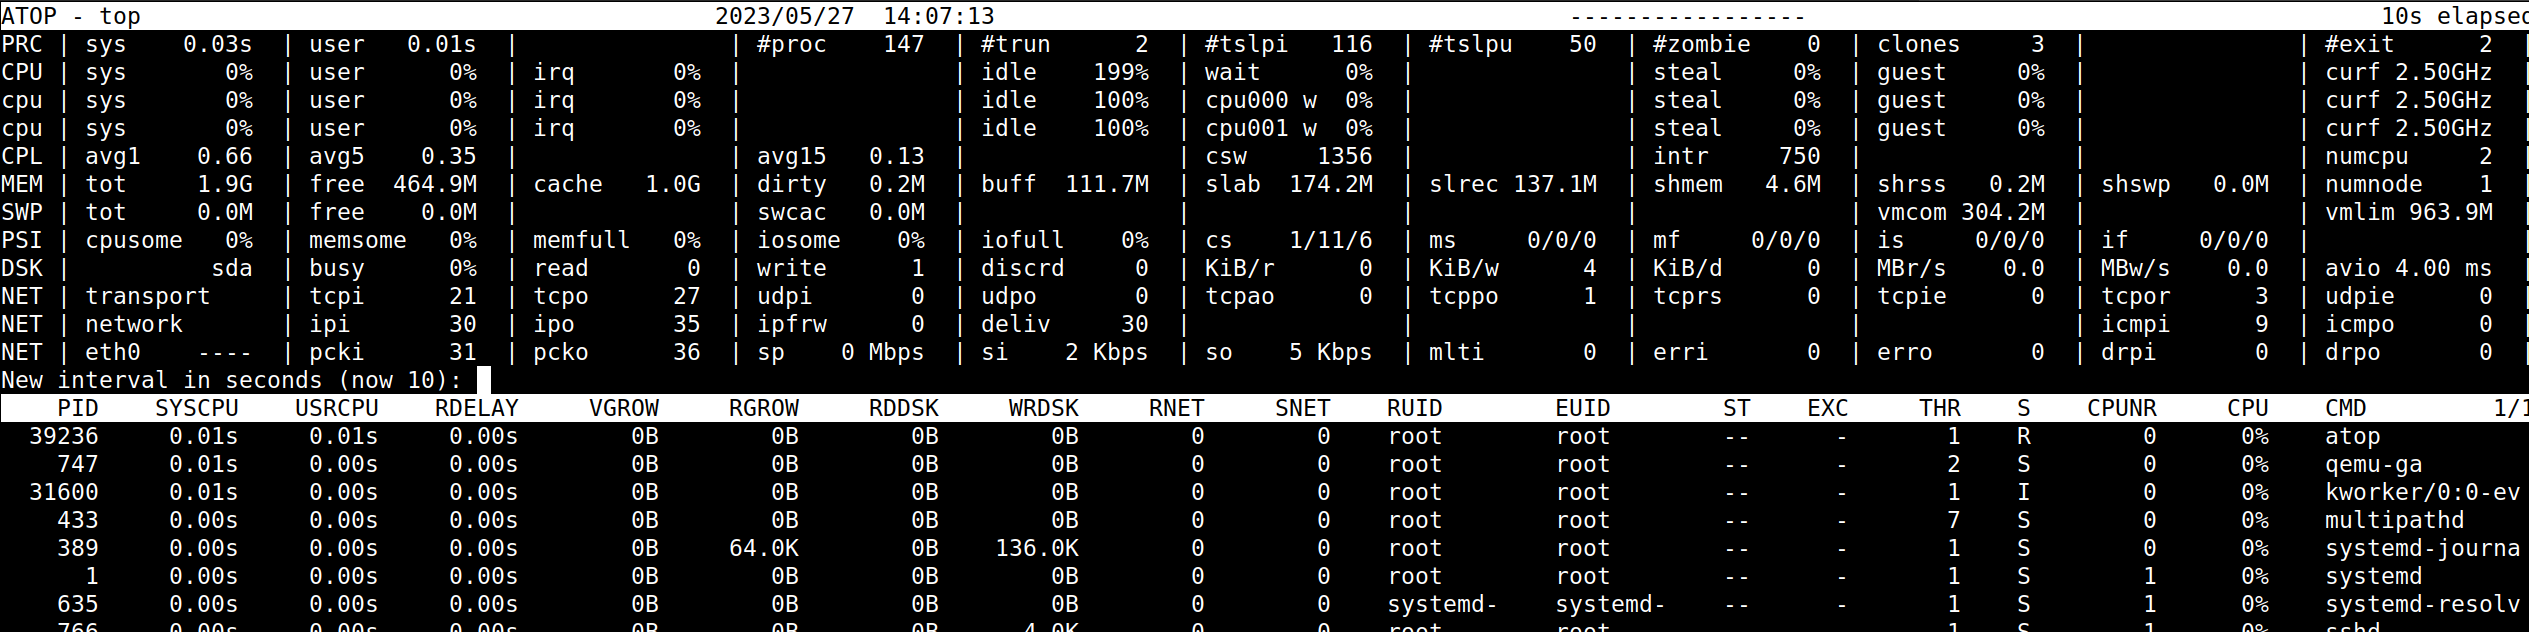
I prefer to set up an interval of 1-2 seconds.
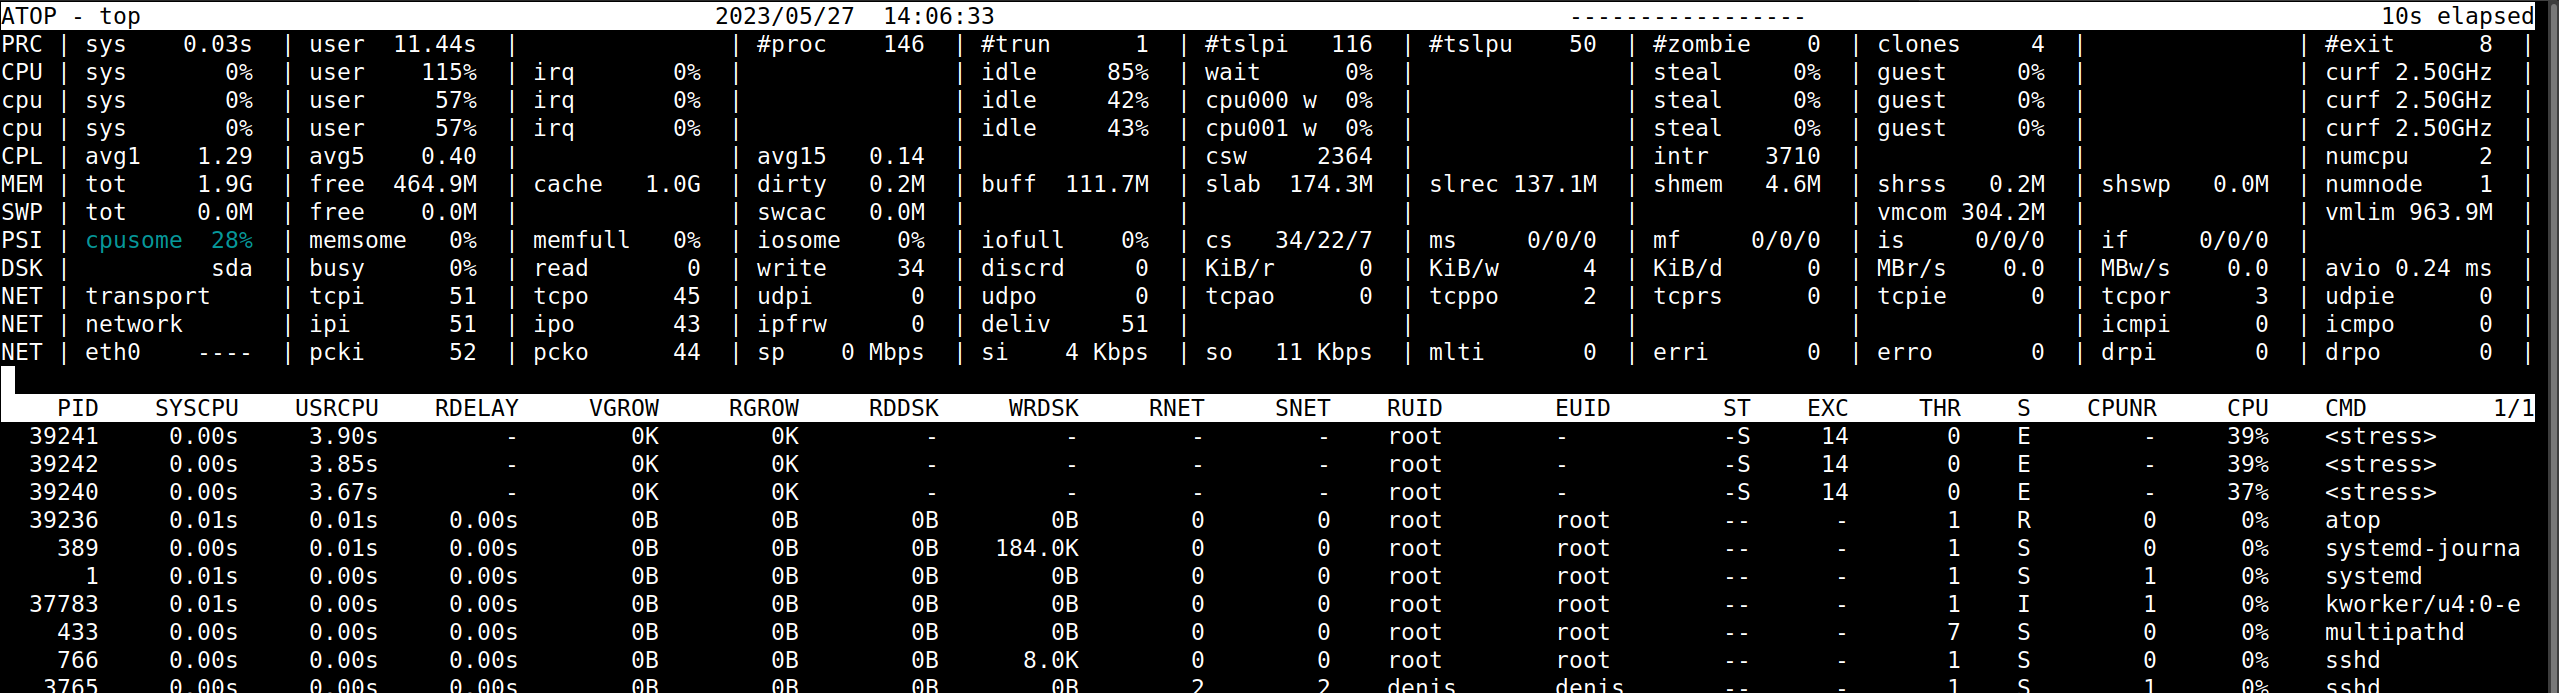
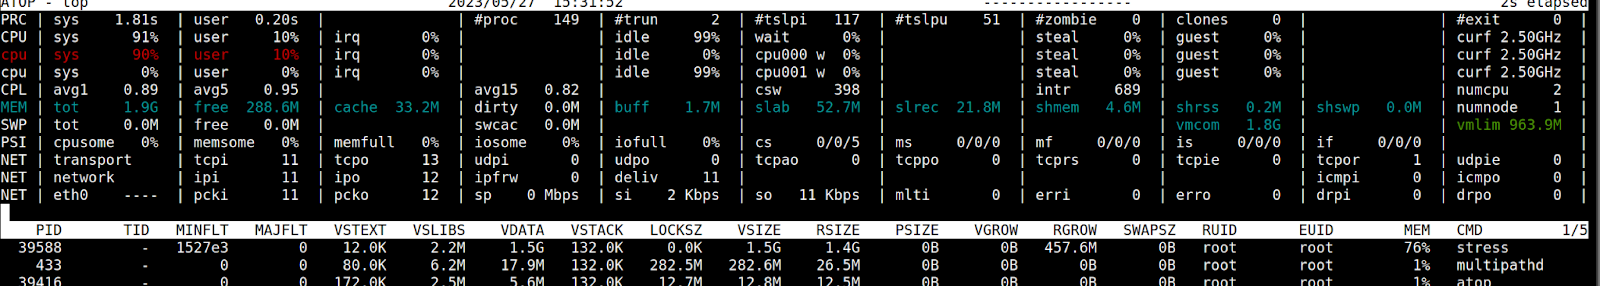
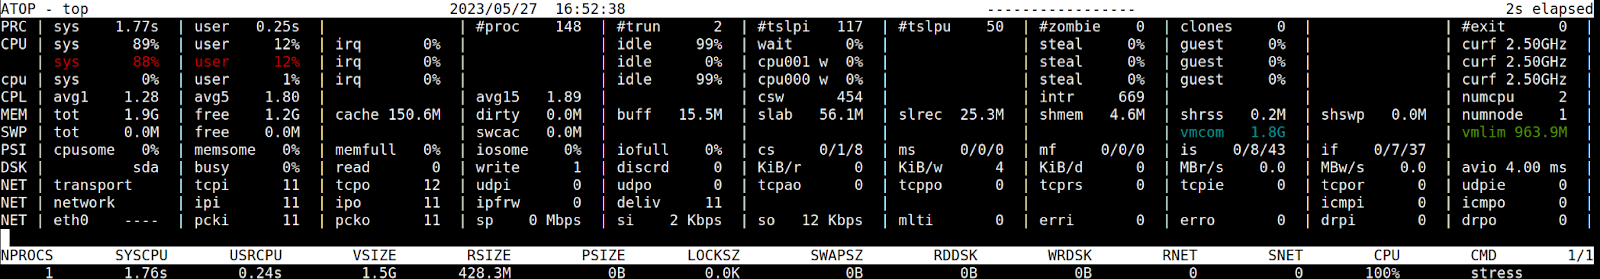
3. In case the consumption of server resources reaches a critical value, it will be marked with a specific color:
- Red if consumption is critical
- Cyan if consumption is almost critical(80% of critical)
The amount considered critical varies for different resources:
- 90% utilization of CPU
- 70% usage of disk
- 90% of network bandwidth
- 90% of memory occupation
- 80% of SWAP
Of course, these parameters can be modified.
Pay attention, the CPU has two cores, and you can see utilization distribution among these cores.
4. For killing a process, press ‘k’ and then type a PID of the process to be killed(it’s similar to ‘top’). Further, you can specify a signal to be sent to a process.
Output Options
Resource Related Output
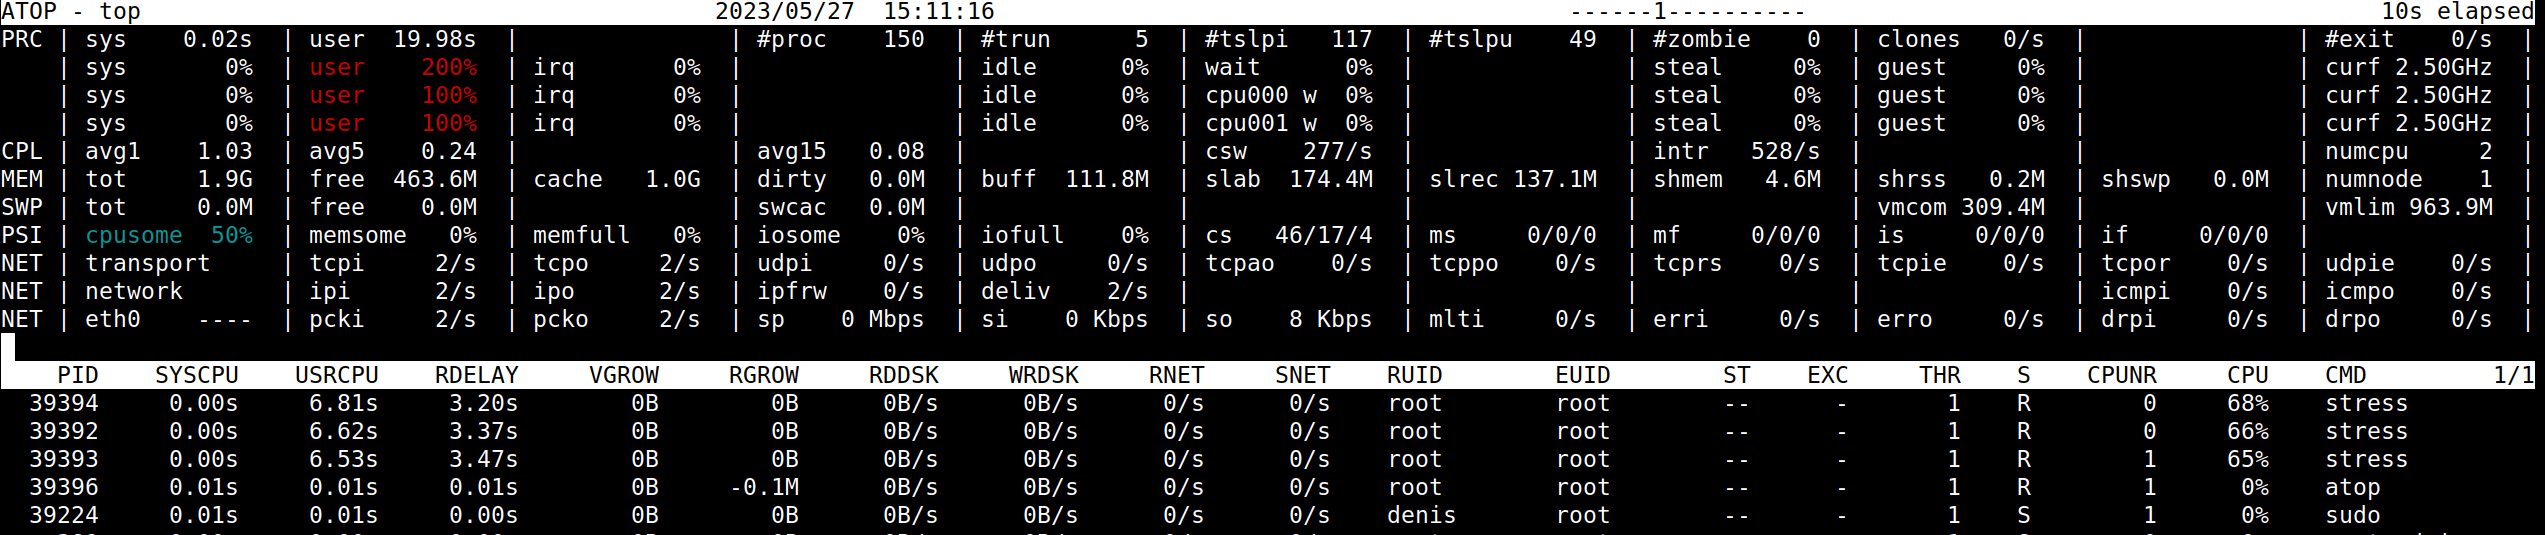
1. To show commands how they have been run, type ‘c’:
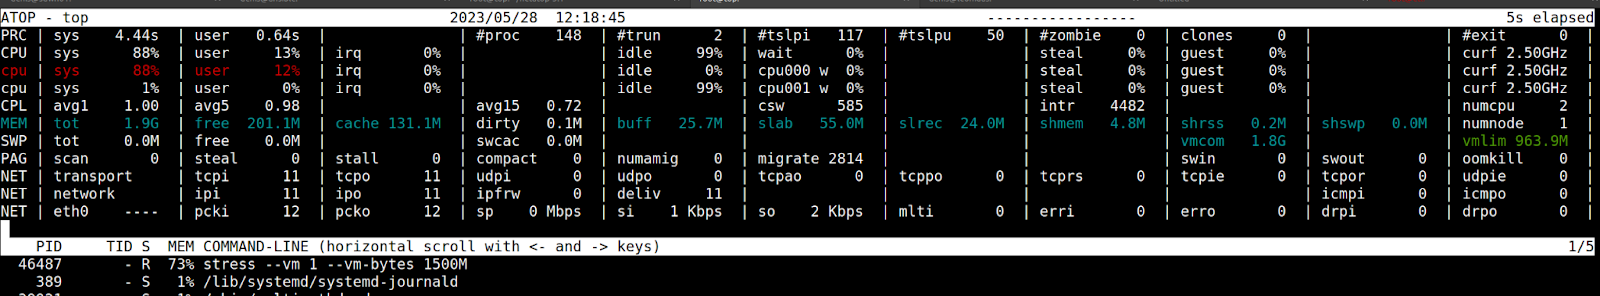
2. If you would like to show all about memory, use the ‘m’ key:
3. There is ‘g’ for showing generic output. It might be needed when you want to revert to initial output. This is the default output.
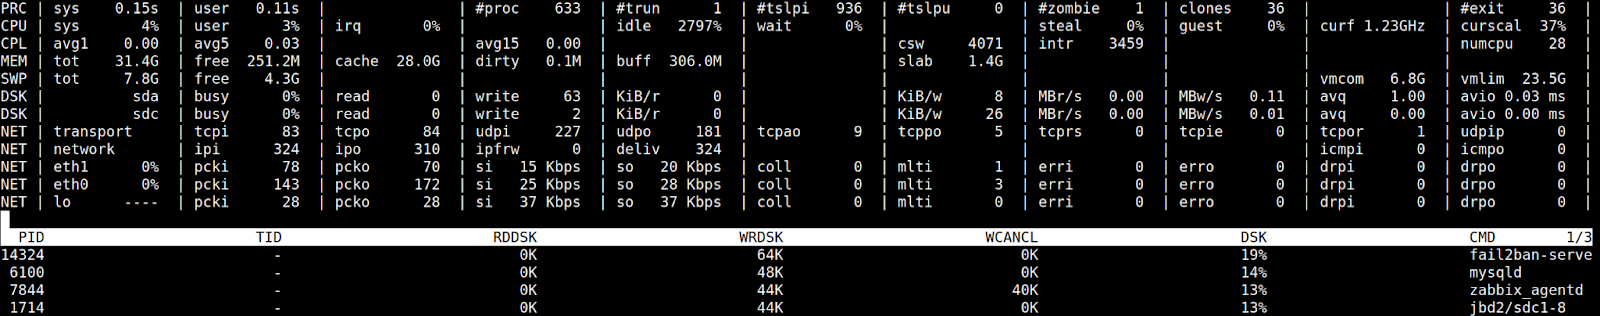
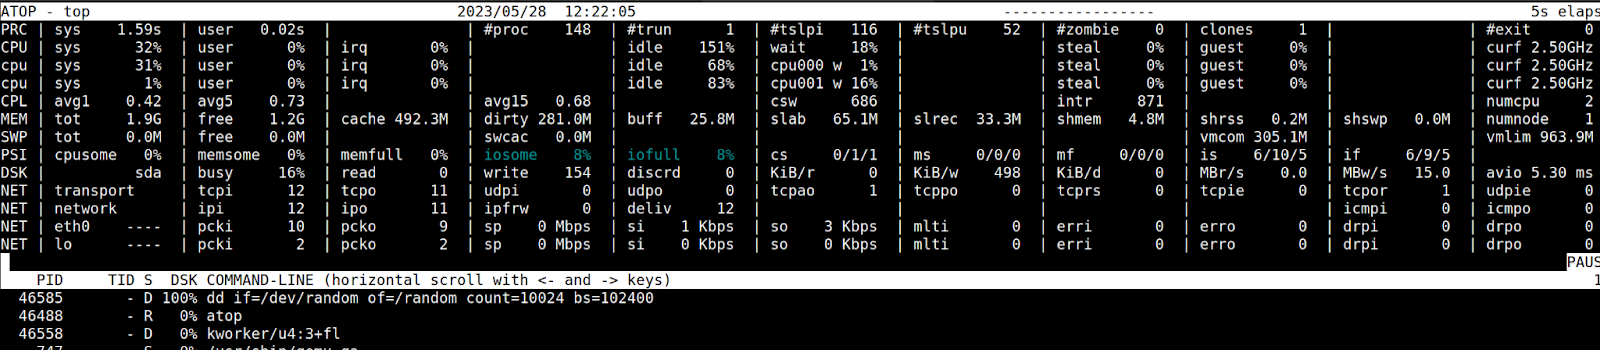
4. For output of disk things, press ‘d’:
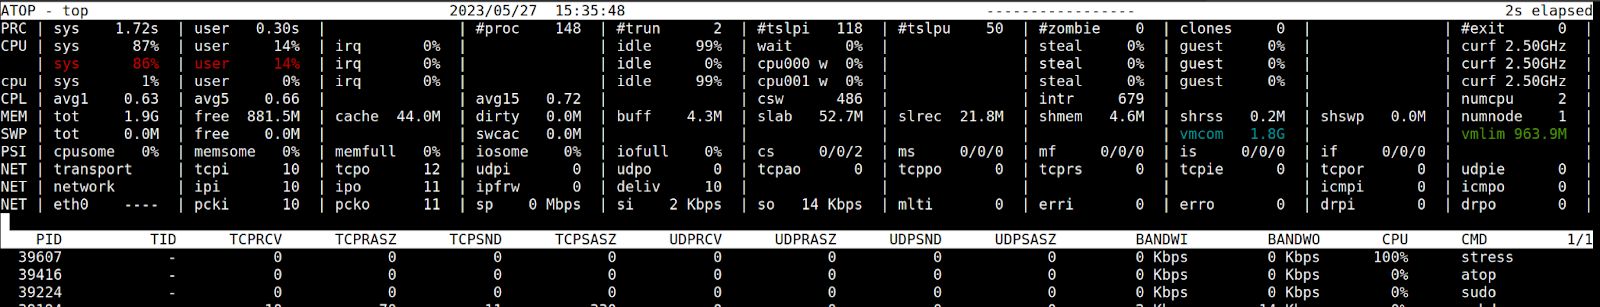
5. Network-related output (UDP, TCP, and bandwidth). For this, press ‘n’:
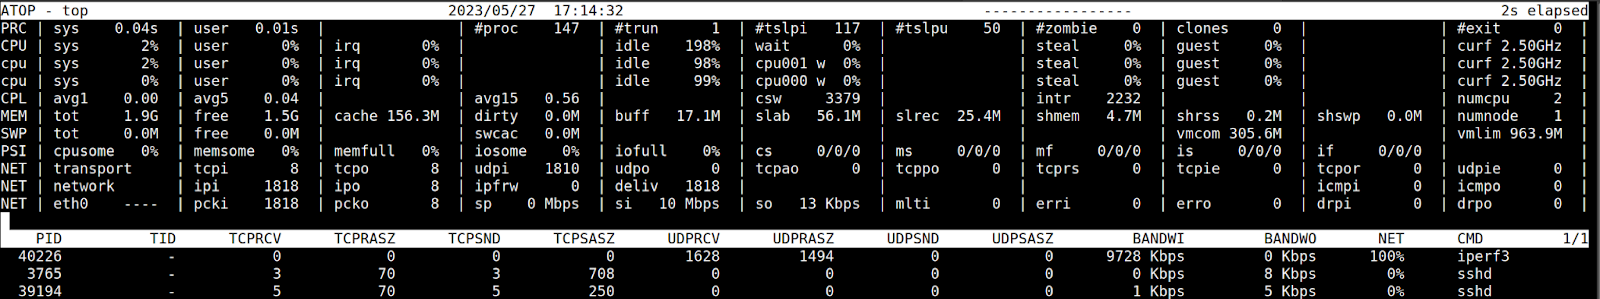
Please, take into account that a kernel module netatop must be installed. Otherwise, atop won’t be out network-related information. This module allows us to show network activity per process. Refer to the official web page.
So, we considered basic options, which is enough for most cases.
Also, there are interesting options I recommend considering:
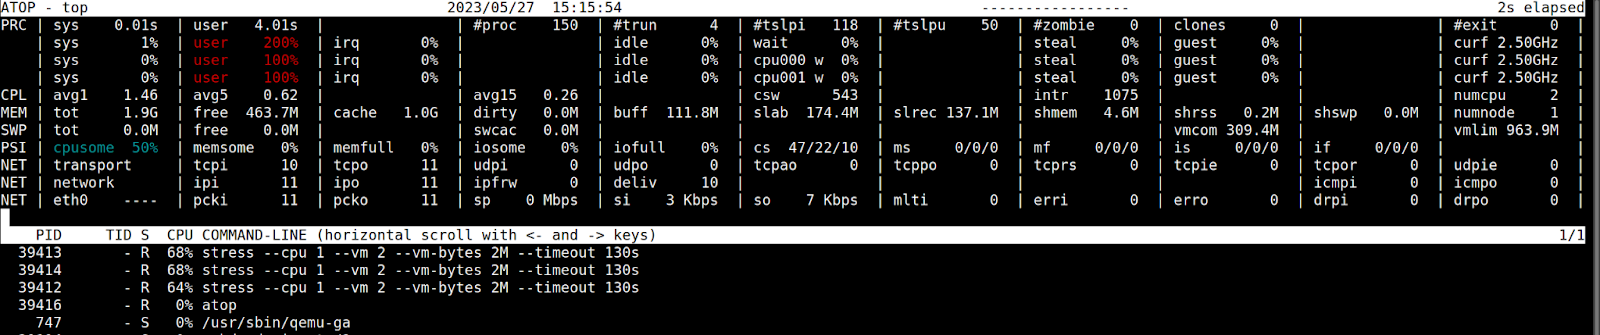
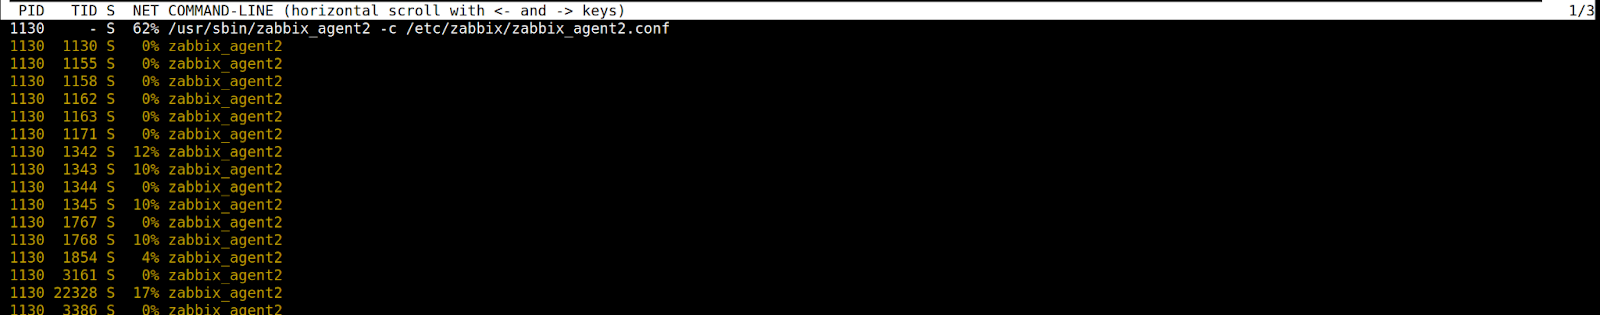
- ‘y’ — for showing per thread. It is a very useful functionality for examining the behavior of multi-threaded applications(or for debugging such apps).
- ‘e’ — shows GPU utilization
- ‘o’ — if you’d like to customize the output, it’s possible in ~/.atoprc, then you can use your own output just by pressing ‘o’
- ‘z’ — if you need to pause your atop
Aggregation Functions
Top of Resources Eaters
1. Switch to show output accumulated per user, push ‘u’:
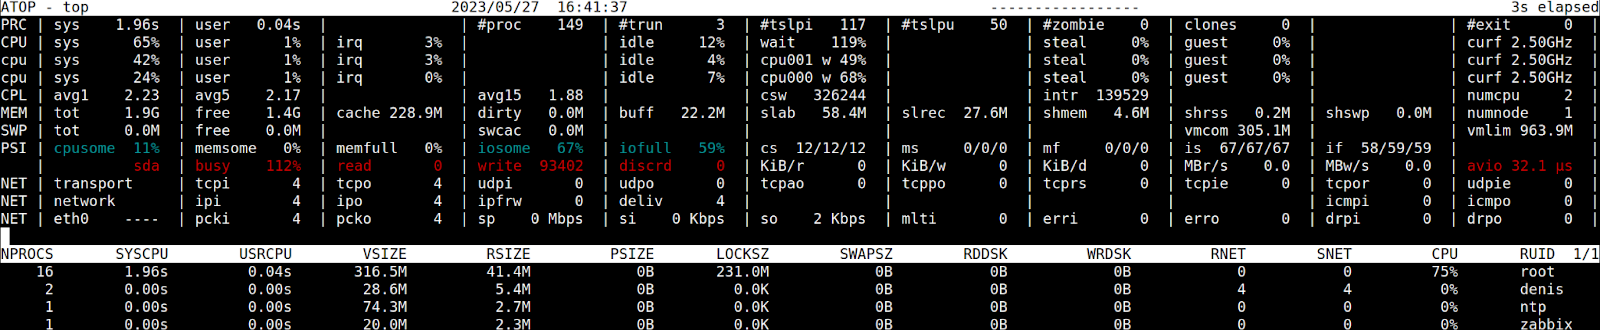
2. Output per process, hit ‘p’:
3. For output processes accumulated per Docker container, there is ‘j’ key:

Where ‘host’ — host native processes. For observing only a specific container, use ‘J’ for this.
Sorting Options
1. For sorting by CPU usage, press shift + ‘c’(or capital C)
This is default behavior.
2. Sort by memory usage, hit shift + ‘m’(capital M)
3. Sort by disk usage, hit shift + ‘d’(capital D)
4. Network utilization sorting, use shift + ‘n’ (capital N)
5. If you are tracking threads, there is option ‘Y’ to aggregate threads by the process.
Note. Sorting and output modifiers are different and should be used in combination.
Incidents Examining (Looking to the Past)
All those rules for real-time monitoring work for looking for events in logs.
Initially, we need to start reading logs instead of real-time status output:
# atop -r /var/log/atop/atop.logWill read the log file.
Navigating
Navigate within the file using the t (forward) and shift+t keys (back). This allows you to go to the next sample or go back to the previous one.
Time Limit
There are options to limit time:
# atop -r /var/log/atop/atop.log -b 1400Opens atop from 14:00 of the current day to the end of the current log file:
<screencast>
# atop -r /var/log/atop/atop_20230523.log -b 1400Opens file written on 25 of May 2023 year after 14:00, and navigates until 23:59 of the 25 of May:
<screencast>
# atop -r /var/log/atop/atop_20230525 -b 14:00 -e 16:00You’ll see records from 14:00 until 16:00 written on 25 of May 2023:
<screencast>
In case your system does not rotate logs, you can use atop's begin and end limitations in such view:
[-b [YYYYMMDD]hhmm ] [-e [YYYYMMDD]hhmm ]As was told above, sorting, aggregating data, and showing specific output related to some resources all these work perfectly in this mode.
Other Atop Capabilities
Atop has a unique feature that allows users to create charts directly in their terminal. To use this feature, you need only Python and pip, then install a specific package atopsar-plot, and you are able to visualize historical data. While this feature may not be particularly useful for modern systems that are already under monitoring, it's worth noting as an additional capability of the program.
Monitor a Process Resource Consumption
When it comes to monitoring a server, having the right tools in place is crucial to ensure optimal performance and identify potential issues. Two popular systems for server monitoring are Zabbix and Prometheus, both of which are capable of monitoring various process resources consumptions such as memory, CPU, and disk usage. These systems can extract information about a process from the /proc filesystem and send it to the server for storage. I should tell you monitoring systems extract info about spending resources by a specific process only or totally by all processes with no differentiation. Atop, in this case, is a powerful tool.
Atop vs. Top
While both atop and top are system performance monitoring tools, they differ in their capabilities and level of detail.
Top is a simple command-line utility that provides a basic overview of the system's current processes and their resource usage. It is useful for quickly identifying processes that are consuming significant resources, but it does not provide detailed information on system activity.
Atop, on the other hand, provides a more detailed report of system activity, including CPU usage, memory usage, and disk I/O. It can also monitor system activity over a period of time, making it useful for analyzing long-term trends and identifying patterns.
Conclusion
Atop is a powerful tool for system performance monitoring and analysis. It provides detailed information on system activity and can be used to diagnose and troubleshoot performance issues, plan for future capacity requirements, monitor security and compliance and allocate resources effectively. While it may be more complex than traditional tools like top, it offers greater insight into system activity and can be an invaluable tool for system administrators and IT professionals.
Opinions expressed by DZone contributors are their own.
Comments