Class Diagrams
Class diagrams describe the static structure of the classes in your system and illustrate attributes, operations and relationships between the classes.
Modeling Classes
The representation of a class has three compartments.
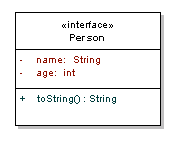
Figure 1: Class representation
From top to bottom this includes:
- Name which contains the class name as well as the stereotype, which provides information about this class. Examples of stereotypes include <<interface>>, <<abstract>> or <<controller>>.
- Attributes lists the class attributes in the format name:type, with the possibility to provide initial values using the format name:type=value
- Operations lists the methods for the class in the format method( parameters):return type.
Operations and attributes can have their visibility annotated as follows: + public, # protected, - private, ~ package
 Interfaces Interface names and operations are
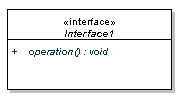 usually represented in italics.
RelationshipDescriptionDependency “...uses a…”A weak, usually transient, relationship that illustrates that a class uses another class at some point.
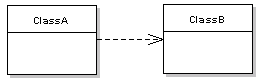
Figure 2: ClassA has dependency on ClassB
Association “…has a...”Stronger than dependency, the solid line relationship indicates that the class retains a reference to another class over time.

Figure 3: ClassA associated with ClassB
Aggregation “…owns a…”More specific than association, this indicates that a class is a container or collection of other classes. The contained classes do not have a life cycle dependency on the container, so when the container is destroyed, the contents are not. This is depicted using a hollow diamond.
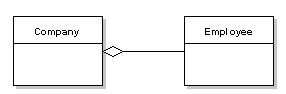
Figure 4: Company contains Employees
Composition “…is part of...”More specific than aggregation, this indicates a strong life cycle dependency between classes, so when the container is destroyed, so are the contents. This is depicted using a filled diamond.
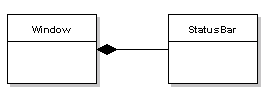
Figure 5: StatusBar is part of a Window
Generalization “…is a…”Also known as inheritance, this indicates that the subtype is a more specific type of the super type. This is depicted using a hollow triangle at the general side of the relationship.
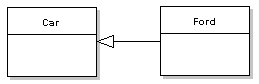
Figure 6: Ford is a more specific type of Car
Association Classes
Sometimes more complex relationships exist between classes, where a third class contains the association information.
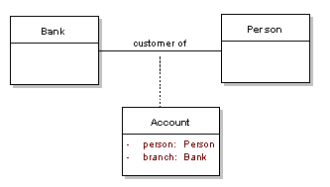
Figure 7: Account associates the Bank with a Person
Annotating relationships
For all the above relationships, direction and multiplicity can be expressed, as well as an annotation for the relationship. Direction is expressed using arrows, which may be bi-directional.
The following example shows a multiple association, between ClassA and ClassB, with an alias given to the link.
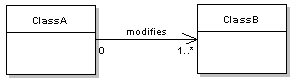
Figure 8: Annotating class relationships
 Notes Notes or comments are used across all UML diagrams. They used to hold useful information for the diagram, such as explanations or code samples, and can be linked to entities in the diagram.
Object Diagrams
Object diagrams provide information about the relationships between instances of classes at a particular point in time. As you would expect, this diagram uses some elements from class diagrams.
Typically, an object instance is modeled using a simple rectangle without compartments, and with underlined text of the format InstanceName:Class
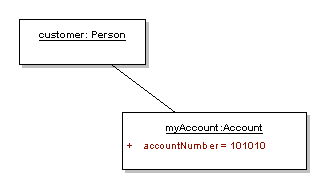
Figure 9: A simple object diagram
The object element may also have extra information to model the state of the attributes at a particular time, as in the case of myAccount in the above example.
Component Diagrams
Component diagrams are used to illustrate how components of a system are wired together at a higher level of abstraction than class diagrams. A component could be modeled by one or more classes.
A component is modeled in a rectangle with the <<component>> classifier and an optional component icon:
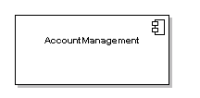
Figure 10: UML representation of a single component
Assembly Connectors
The assembly connector can be used when one component needs to use the services provided by another.
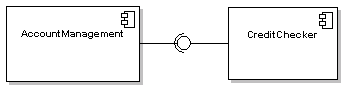
Figure 11: AccountManagement depends on the CreditChecker services
Using the ball and socket notation, required or provided interfaces are illustrated as follows
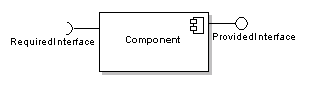
Figure 12: Required and provided interface notationPort Connectors
Ports allow you to model the functionality that is exposed to the outside world, grouping together required and provided interfaces for a particular piece of functionality. This is particularly useful when showing nested components.
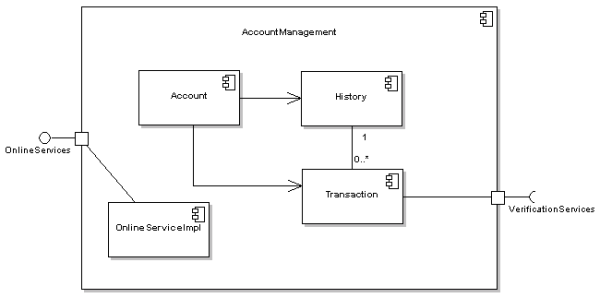
Figure 13: Nested component diagram showing use of ports
Composite Structure Diagrams
Composite structure diagrams show the internal structure of a class and the collaborations that are made possible.
The main entities in a composite structure diagram are parts, ports, connectors, collaborations, as well as classifiers.
Parts
Represent one or more instances owned by the containing instance. This is illustrated using simple rectangles within the owning class or component. Relationships between parts may also be modeled.
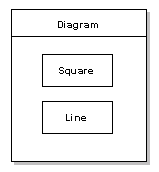
Figure 14: Diagram class with a Square and Line as part of its structure
Ports
Represent externally visible parts of the structure. They are shown as named rectangles at the boundary of the owning structure. As in component diagrams, a port can specify the required and provided services.
Connectors
Connectors bind entities together, allowing them to interact at runtime. A solid line is typically drawn between parts. The name and type information is added to the connector using a name:classname format. Multiplicity may also be annotated on the connector.
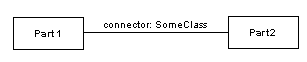
Figure 15: A connector between two parts
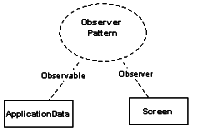
Collaborations
Represents a set of roles that can be used together to achieve some particular functionality. Collaborations are modeled using a dashed ellipse.
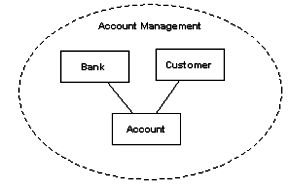
Figure 16: Collaboration between a number of entities
 Modeling Patterns Using Collaborations Sometimes a collaboration will be an implementation of a pattern. In such cases a collaboration is labeled with the pattern and each part is linked with a description of its role in the problem.
Deployment Diagrams
Deployment diagrams model the runtime architecture of the system in a real world setting. They show how software entities are deployed onto physical hardware nodes and devices.
Association links between these entities represent communication between nodes and can include multiplicity.
EntityDescription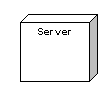 Either a hardware or software element shown as a 3D box shape. Nodes can have many stereotypes, indicated by an appropriate icon on the top right hand corner. An instance is made different to a node by providing an underlined “name:node type” notation.
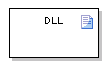 An artifact is any product of software development, including source code, binary files or documentation. It is depicted using a document icon in the top right hand corner.
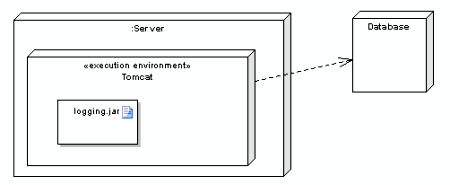
Figure 17: Deployment diagram example
Package Diagrams
Package diagrams show the organization of packages and the elements inside provide a visualization of the namespaces that will be applied to classes. Package diagrams are commonly used to organize, and provide a high level overview of, class diagrams.
As well as standard dependencies, there are two specific types of relationships used for package diagrams. Both are depicted using the standard dashed line dependency with the appropriate stereotype (import or merge).
- Package Import Used to indicate that the importing namespace adds the names of the members of the package to its own namespace. This indicates that the package can access elements within another package. Unlabeled dependencies are considered imports.
- Package Merge Used to indicate that the contents of both packages are combined in a similar way to the generalization relationship.
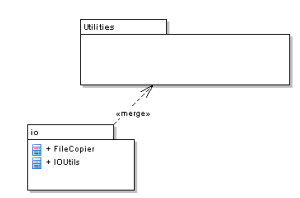
Figure 18: Package merge example
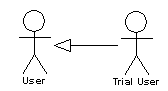 Actors represent external entities in the system and can be human, hardware or other systems. Actors are drawn using a stick figure. Generalization relationships can be used to represent more specific types of actors, as in the example.
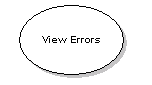 A use case represents a unit of functionality that can interact with external actors or related to other use cases. Use cases are represented with a ellipse with the use case name inside.BoundaryUse cases are contained within a system boundary, which is depicted using a simple rectangle. External entities must not be placed within the system boundaryGraphical ElementsNotationDescriptionIncludes
 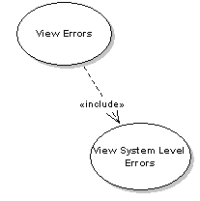 Illustrates that a base use case may include another, which implies that the included use case behavior is inserted into the behavior of the base use case.Extends
 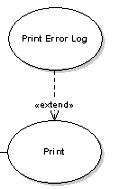 Illustrates that a particular use case provides additional functionality to the base use case, in some alternative flows. This can be read to mean that it’s not required to complete the goal of the base use case.GeneralizationUsed when there is a common use case that provides basic functionality that can be used by a more specialized use case.
 Multiplicity Like normal relationships, all use case relationships can include multiplicity annotations.
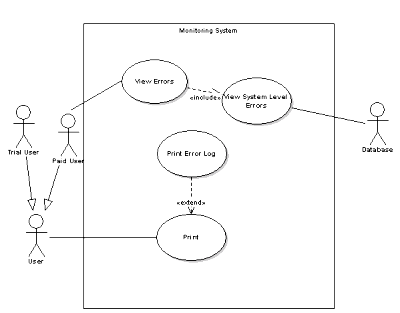
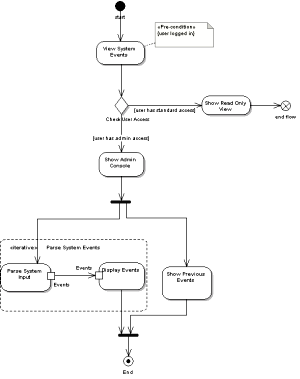
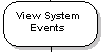 Represents one step in the program flow, illustrated using a rounded rectangle.Constraints
 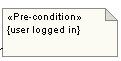 Action constraints are linked to an action in a note with text of the format <<stereotype>>{constraint}Start Node
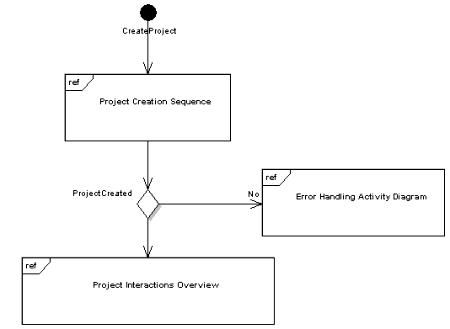
  The start node is used to represent where the flow begins. This is illustrated using a single back spot.Activity Final Node
  Represents the end of all control flows within the activity.Flow Final Node
  Represents the end of a single flow.Control Flow
  Represents the flow of control from one action to the next as a solid line with an arrowhead.Object Flow
 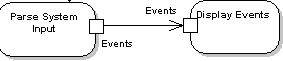 If an object is passed between activities, a representation of the object can be added in between the activities. It is also possible represent object flow by adding a square representing the object on either side of the control flow.Decision Node
 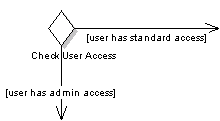 An annotated diamond shape is used to represent decisions in the control flow. This can also be used to merge flows. A decision node will have a condition documented that needs to be met before that path can be taken.Fork Node
  Represented using a horizontal or vertical bar, a fork node illustrates the start of concurrent threads. The same notation can be used for the joining of concurrent threads.Partition
 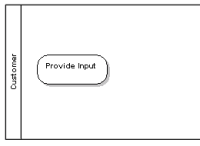 Swimlanes can be used in activity diagrams to illustrate activities performed by different actors.Region
 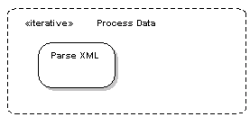 Regions are used to group certain activities together. A stereotype is applied to the region to identify whether it is iterative or parallel. Regions are illustrated using a dotted rounded rectangle.
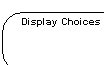 States model a moment in time for the behavior of a classifier. It is illustrated using a rounded rectangle.Initial Post
  Represents the beginning of the execution of this state machine. Illustrated using a filled circle.Entry Point
  In cases when it is possible to enter the state machine at a later stage than the initial state this can be used. Illustrated using an empty circle.Final State
  Represents the end of the state machine execution. Represented using a circle containing a black dot.Exit Point
  Represents alternative end points to the final state, of the state machine. Illustrated using a circle with a X.Transition
  Represented as a line with an arrowhead. Transitions illustrate movement between states. They can be annotated with a Trigger[Guard]/Effect notation. States may also have self transitions, useful for iterative behavior.State
 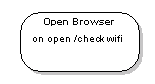 A state can also be annotated with any number of trigger/effect pairs, which is useful when the state has a number of transitions.Nested States
 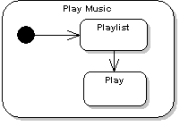 States can themselves contain internal state machine diagrams.State Choice
 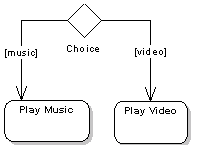 A decision is illustrated using a diamond, with a number of transitions leaving from the choice element.State junction
 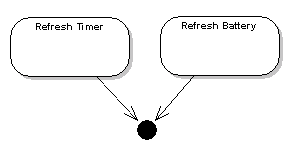 Junctions are used to merge a number of transitions from different states. A junction is illustrated using a filled circle.Terminate State
  Indicates that the flow of the state machine has ended, illustrated using an XHistory State
  History states can be used to model state memory, where the state resumes from where it was last time. This is drawn using a circle with a H inside.Concurrent Region
 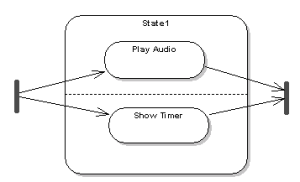 A state can have multiple substates executing concurrently, which is modeled using a dashed line to separate the parallel tracks. Forks and merges (see activity diagram) are used to split/merge transitions.
 Transitions: Triggers, Guards, Effects Triggers cause the transition, which is usually a change in condition. A guard is a condition that must evaluate to true before the transition can execute. Effect is an action that will be invoked on that object.
 Actors represent external entities in the system. They can be human, hardware or other systems. Actors are drawn using a stick figure.General Lifeline
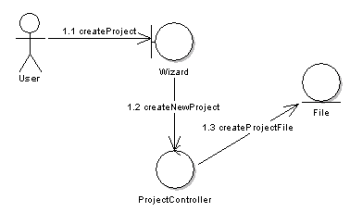
 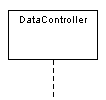 Represents an individual entity in the sequence diagram, displayed as a rectangle. It can have a name, stereotype or could be an instance (using instance:class)Boundary
 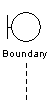 Boundary elements are usually at the edge of the system, such as user interface, or back-end logic that deals with external systems.Control
 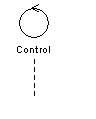 Controller elements manage the flow of information for a scenario. Behavior and business rules are typically managed by such objects.Entity
 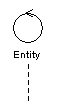 Entities are usually elements that are responsible for holding data or information. They can be thought of as beans, or model objects.
 Swimlanes Swimlanes can be used to break up a sequence diagram into logical layers. A swimlane can contain any number of lifelines.
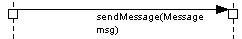 A message with a solid arrowhead at the end. If the message is a return message it appears as a dashed line rather than solid.Asynchronous
 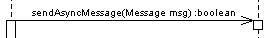 A message with a line arrowhead at the end. If the message is a return message it appears as a dashed line rather than solid.Lost
 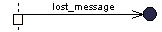 A lost message is one that gets sent to an unintended receiver, or to an object that is not modeled in the diagram. The destination for this message is a black dot.Found
 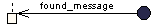 A found message is one that arrives from an unknown sender, or from an object that is not modeled in the diagram. The unknown part is modeled as a black dot.Self MessageA self message is usually a recursive call, or a call to another method belonging to the same object.
 Managing Object Lifecycle Objects don’t need to all appear along the top of the sequence diagram. When a message is sent to create an object, the element’s lifeline can begin at the end of that message. To terminate the lifeline, simply use an X at the end of the dashed line.
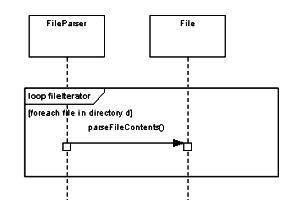
{{ parent.title || parent.header.title}}
{{ parent.tldr }}
{{ parent.linkDescription }}
{{ parent.urlSource.name }}