Operation and Network Administration Management of Telecom 5G Network Functions Using Openshift Kubernetes Tools
Learn how 5G Telecom Operators can adopt Prometheus, Grafana, and Alert Manager tools for monitoring and alerting their Network Functions in the Kubernetes cloud.
Join the DZone community and get the full member experience.
Join For FreeThe world of Telecom is evolving at a rapid pace, and it is not just important, but crucial for operators to stay ahead of the game. As 5G technology becomes the norm, it is not just essential, but a strategic imperative to transition seamlessly from 4G technology (which operates on OpenStack cloud) to 5G technology (which uses Kubernetes).
In the current scenario, operators invest in multiple vendor-specific monitoring tools, leading to higher costs and less efficient operations. However, with the upcoming 5G world, operators can adopt a unified monitoring and alert system for all their products. This single system, with its ability to monitor network equipment, customer devices, and service platforms, offers a reassuringly holistic view of the entire system, thereby reducing complexity and enhancing efficiency.
By adopting a Prometheus-based monitoring and alert system, operators can streamline operations, reduce costs, and enhance customer experience. With a single monitoring system, operators can monitor their entire 5G system seamlessly, ensuring optimal performance and avoiding disruptions.
This practical solution eliminates the need for a complete overhaul and offers a cost-effective transition.
Let's dive deep.
Prometheus, Grafana, and Alert Manager
Prometheus is a tool for monitoring and alerting systems, utilizing a pull-based monitoring system. It scrapes, collects, and stores Key Performance Indicators (KPI) with labels and timestamps, enabling it to collect metrics from targets, which are the Network Functions' namespaces in the 5G telecom world.
Grafana is a dynamic web application that offers a wide range of functionalities. It visualizes data, allowing the building of charts, graphs, and dashboards that the 5G Telecom operator wants to visualize. Its primary feature is the display of multiple graphing and dashboarding support modes using GUI (Graphical user interface). Grafana can seamlessly integrate data collected by Prometheus, making it an indispensable tool for telecom operators. It is a powerful web application that supports the integration of different data sources into one dashboard, enabling continuous monitoring. This versatility improves response rates by alerting the telecom operator's team when an incident emerges, ensuring a minimum 5G network function downtime.
The Alert Manager is a crucial component that manages alerts from the Prometheus server via alerting rules. It manages the received alerts, including silencing and inhibiting them and sending out notifications via email or chat. The Alert Manager also removes duplications, grouping, and routing them to the centralized webhook receiver, making it a must-have tool for any telecom operator.
Architectural Diagram
Prometheus
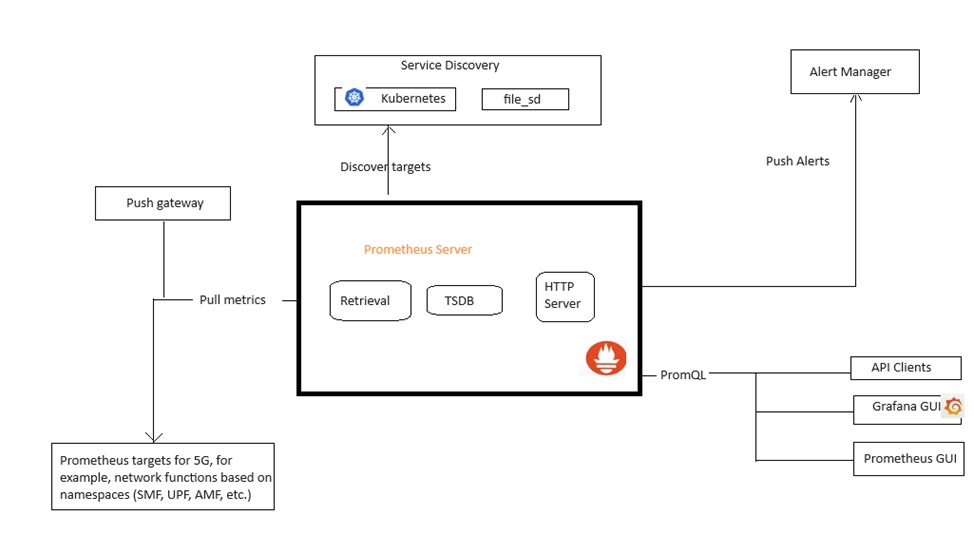
Components of Prometheus (Specific to a 5G Telecom Operator)
- Core component: Prometheus server scrapes HTTP endpoints and stores data (time series).
- The Prometheus server, a crucial component in the 5G telecom world, collects metrics from the Prometheus targets. In our context, these targets are the Kubernetes cluster that houses the 5G network functions.
- Time series database (TSDB): Prometheus stores telecom Metrics as time series data.
- HTTP Server: API to query data stored in TSDB; The Grafana dashboard can query this data for visualization.
- Telecom operator-specific libraries (5G) for instrumenting application code.
- Push gateway (scrape target for short-lived jobs)
- Service Discovery: In the world of 5G, network function pods are constantly being added or deleted by Telecom operators to scale up or down. Prometheus's adaptable service discovery component monitors the ever-changing list of pods.
- The Prometheus Web UI, accessible through port 9090, is a data visualization tool. It allows users to view and analyze Prometheus data in a user-friendly and interactive manner, enhancing the monitoring capabilities of the 5G telecom operators.
- The Alert Manager, a key component of Prometheus, is responsible for handling alerts. It is designed to notify users if something goes wrong, triggering notifications when certain conditions are met. When alerting triggers are met, Prometheus alerts the Alert Manager, which sends alerts through various channels such as email or messenger, ensuring timely and effective communication of critical issues.
- Grafana for dashboard visualization (actual graphs)
With Prometheus's robust components, your Telecom operator's 5G network functions are monitored with diligence, ensuring reliable resource utilization, tracking performance, detection of errors in availability, and more. Prometheus can provide you with the necessary tools to keep your network running smoothly and efficiently.
Prometheus Features
- The multi-dimensional data model identified by metric details uses PromQL (Prometheus Querying Language) as the query language and the HTTP Pull model.
- Telecom operators can now discover 5G network functions with service discovery and static configuration.
- The multiple modes of dashboard and GUI support provide a comprehensive and customizable experience for users.
Prometheus Remote Write to Central Prometheus from Network Functions
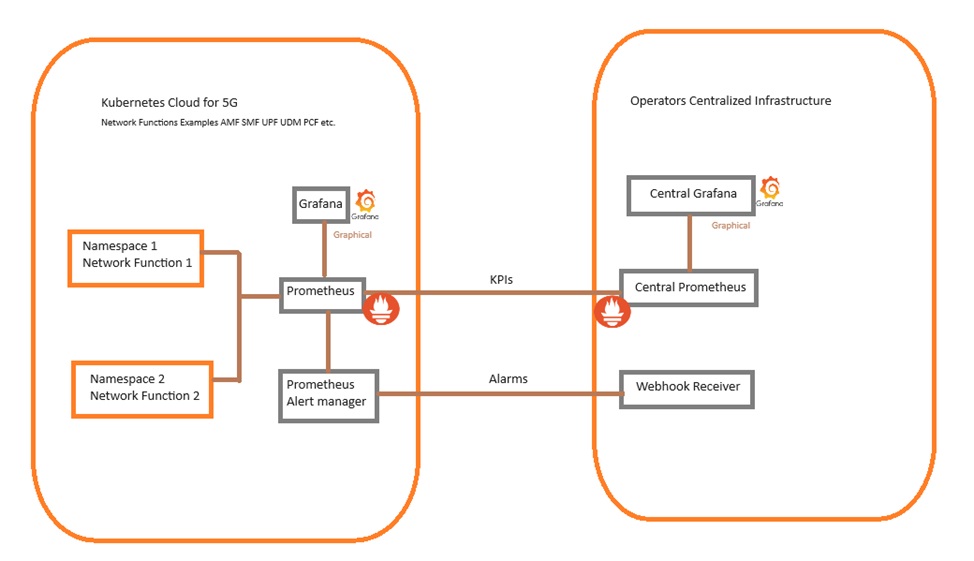
5G Operators will have multiple network functions from various vendors, such as SMF (Session Management Function), UPF (User Plane Function), AMF (Access and Mobility Management Function), PCF (Policy Control Function), and UDM (Unified Data Management).
Using multiple Prometheus/Grafana dashboards for each network function can lead to a complex and inefficient 5G network operator monitoring process. To address this, it is highly recommended that all data/metrics from individual Prometheus be consolidated into a single Central Prometheus, simplifying the monitoring process and enhancing efficiency.
The 5G network operator can now confidently monitor all the data at the Central Prometheus's centralized location. This user-friendly interface provides a comprehensive view of the network's performance, empowering the operator with the necessary tools for efficient monitoring.
Grafana
Grafana Features
- Panels: This powerful feature empowers operators to visualize Telecom 5G data in many ways, including histograms, graphs, maps, and KPIs. It offers a versatile and adaptable interface for data representation, enhancing the efficiency and effectiveness of your data analysis.
- Plugins: This feature efficiently renders Telecom 5G data in real-time on a user-friendly API (Application Programming Interface), ensuring operators always have the most accurate and up-to-date data at their fingertips. It also enables operators to create data source plugins and retrieve metrics from any API.
- Transformations: This feature allows you to flexibly adapt, summarize, combine, and perform KPI metrics query/calculations across 5G network functions data sources, providing the tools to effectively manipulate and analyze your data.
- Annotations: Rich events from different Telecom 5G network functions data sources are used to annotate metrics-based graphs.
- Panel editor: Reliable and consistent graphical user interface for configuring and customizing 5G telecom metrics panels
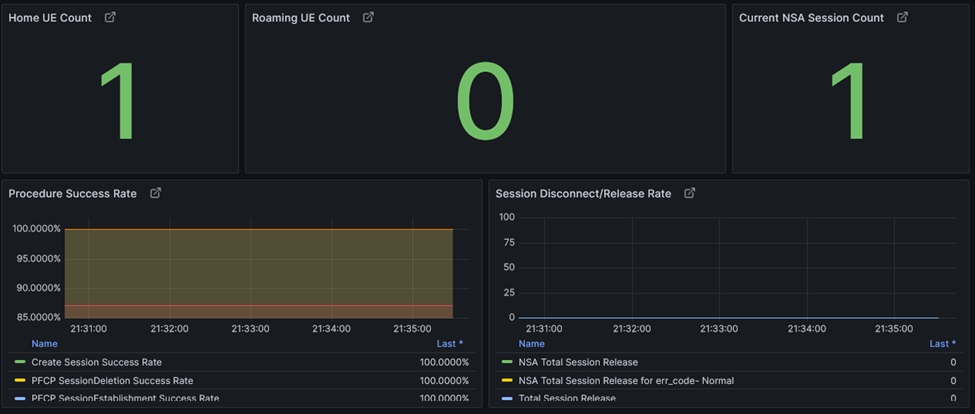
Grafana Sample Dashboard GUI for 5G
Alert Manager
Alert Manager Components
- The Ingester swiftly ingests all alerts, while the Grouper groups them into categories.
- The De-duplicator prevents repetitive alerts, ensuring you're not bombarded with notifications.
- The Silencer is there to mute alerts based on a label, and the Throttler regulates the frequency of alerts.
- Finally, the Notifier will ensure that third parties are notified promptly.
Alert Manager Functionalities
- Grouping:
- Grouping categorizes similar alerts into a single notification system. This is helpful during more extensive outages when many 5G network functions fail simultaneously and when all the alerts need to fire simultaneously.
- The telecom operator will expect only to get a single page while still being able to visualize the exact service instances affected.
- Inhibition:
- Inhibition suppresses the notification for specific low-priority alerts if certain major/critical alerts are already firing.
- For example, when a critical alert fires, indicating that an entire 5G SMF (Session Management Function) cluster is not reachable, AlertManager can mute all other minor/warning alerts concerning this cluster.
- Silences: Silences are simply mute alerts for a given time. Incoming alerts are checked to match the regular expression matches of an active silence. If they match, no notifications will be sent out for that alert.
- High availability: Telecom operators will not load balance traffic between Prometheus and all its Alert Managers; instead, they will point Prometheus to a list of all Alert Managers.
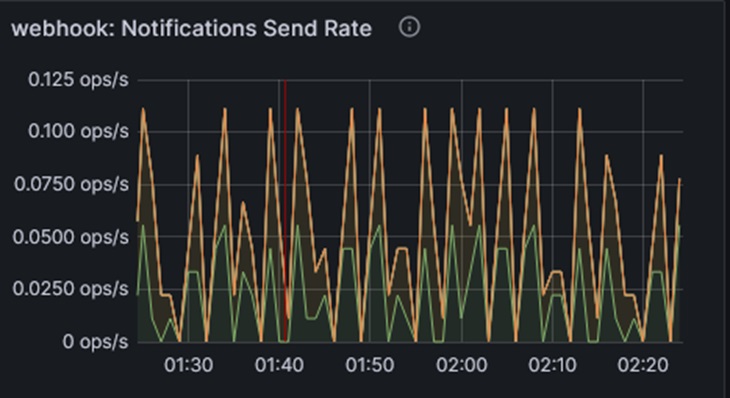
Dashboard Visualization
Grafana dashboard visualizes the Alert Manager webhook traffic notifications as shown below:
Configuration YAMLs (Yet Another Markup Language)
Telecom Operators can install and run Prometheus using the configuration below:
prometheus:
  enabled: true
  route:
    enabled: {}
  nameOverride: Prometheus
  tls:
    enabled: true
    certificatesSecret: backstage-prometheus-certs
    certFilename: tls.crt
    certKeyFilename: tls.key
  volumePermissions:
    enabled: true
  initdbScriptsSecret: backstage-prometheus-initdb
  prometheusSpec:
    retention: 3d
    replicas: 2
    prometheusExternalLabelName: prometheus_cluster
    image:
      repository: <5G operator image repository for Prometheus>
      tag: <Version example v2.39.1>
      sha: ""
    podAntiAffinity: "hard"
    securityContext: null
    resources:
      limits:
        cpu: 1
        memory: 2Gi
      requests:
        cpu: 500m
        memory: 1Gi
    serviceMonitorNamespaceSelector:
      matchExpressions:
        - {key: namespace, operator: In, values: [<Network function 1 namespace>, <Network function 2 namespace>]}
    serviceMonitorSelectorNilUsesHelmValues: false
    podMonitorSelectorNilUsesHelmValues: false
    ruleSelectorNilUsesHelmValues: false
Configuration to route scrape data segregated based on the namespace and route to Central Prometheus.
- Note: The below configuration can be appended to the Prometheus mentioned in the above installation YAML.
    remoteWrite:
      - url: <Central Prometheus URL for namespace 1 by 5G operator>
        basicAuth:
          username:
            name: <secret username for namespace 1>
            key: username
          password:
            name: <secret password for namespace 1>
            key: password
        tlsConfig:
          insecureSkipVerify: true
        writeRelabelConfigs:
        - sourceLabels:
          - namespace
          regex: <namespace 1>
          action: keep
      - url: <Central Prometheus URL for namespace 2 by 5G operator>
        basicAuth:
          username:
            name: <secret username for namespace 2>
            key: username
          password:
            name: <secret password for namespace 2>
            key: password
        tlsConfig:
          insecureSkipVerify: true
        writeRelabelConfigs:
        - sourceLabels:
          - namespace
          regex: <namespace 2>
          action: keep
Telecom Operators can install and run Grafana using the configuration below.
grafana:
  replicas: 2
  affinity:
    podAntiAffinity:
      requiredDuringSchedulingIgnoredDuringExecution:
        - labelSelector:
            matchExpressions:
              - key: "app.kubernetes.io/name"
                operator: In
                values:
                  - Grafana
          topologyKey: "kubernetes.io/hostname"
  securityContext: false
  rbac:
    pspEnabled: false # Must be disabled due to tenant permissions
    namespaced: true
  adminPassword: admin
  image:
    repository: <artifactory>/Grafana
    tag: <version>
    sha: ""
    pullPolicy: IfNotPresent
  persistence:
    enabled: false
  initChownData:
    enabled: false
  sidecar:
    image:
      repository: <artifactory>/k8s-sidecar
      tag: <version>
      sha: ""
    imagePullPolicy: IfNotPresent
    resources:
     limits:
       cpu: 100m
       memory: 100Mi
     requests:
       cpu: 50m
       memory: 50Mi
    dashboards:
      enabled: true
      label: grafana_dashboard
      labelValue: "Vendor name"
    datasources:
      enabled: true
      defaultDatasourceEnabled: false
  additionalDataSources:
  - name: Prometheus
    type: Prometheus
    url: http://<prometheus-operated>:9090
    access: proxy
    isDefault: true
    jsonData:
      timeInterval: 30s
  resources:
   limits:
     cpu: 400m
     memory: 512Mi
   requests:
     cpu: 50m
     memory: 206Mi
  extraContainers:
    - name: oauth-proxy
      image: <artifactory>/origin-oauth-proxy:<version>
      imagePullPolicy: IfNotPresent
      ports:
        - name: proxy-web
          containerPort: 4181
      args:
        - --https-address=:4181
        - --provider=openshift
        # Service account name here must be "<Helm Release name>-grafana"
        - --openshift-service-account=monitoring-grafana
        - --upstream=http://localhost:3000
        - --tls-cert=/etc/tls/private/tls.crt
        - --tls-key=/etc/tls/private/tls.key
        - --cookie-secret=SECRET
        - --pass-basic-auth=false
      resources:
        limits:
          cpu: 100m
          memory: 256Mi
        requests:
          cpu: 50m
          memory: 128Mi
      volumeMounts:
        - mountPath: /etc/tls/private
          name: grafana-tls
  extraContainerVolumes:
    - name: grafana-tls
      secret:
        secretName: grafana-tls
  serviceAccount:
    annotations:
      "serviceaccounts.openshift.io/oauth-redirecturi.first":  https://[SPK exposed IP for Grafana]
  service:
    targetPort: 4181
    annotations:
      service.alpha.openshift.io/serving-cert-secret-name: <secret>
Telecom Operators can install and run Alert Manager using the configuration below.
alertmanager:
  enabled: true
  alertmanagerSpec:
    image:
      repository: prometheus/alertmanager
      tag: <version>
    replicas: 2
    podAntiAffinity: hard
    securityContext: null
    resources:
      requests:
        cpu: 25m
        memory: 200Mi
      limits:
        cpu: 100m
        memory: 400Mi
    containers:
      - name: config-reloader
        resources:
          requests:
            cpu: 10m
            memory: 10Mi
          limits:
            cpu: 25m
            memory: 50Mi
Configuration to route Prometheus Alert Manager data to the Operator's centralized webhook receiver.
- Note: The below configuration can be appended to the Alert Manager mentioned in the above installation YAML.
config:
    global:
      resolve_timeout: 5m
    route:
      group_by: ['alertname']
      group_wait: 30s
      group_interval: 5m
      repeat_interval: 12h
      receiver: 'null'
      routes:
      - receiver: '<Network function 1>'
        group_wait: 10s
        group_interval: 10s
        group_by: ['alertname','oid','action','time','geid','ip']
        matchers:
        - namespace="<namespace 1>"
      - receiver: '<Network function 2>'
        group_wait: 10s
        group_interval: 10s
        group_by: ['alertname','oid','action','time','geid','ip']
        matchers:
        - namespace="<namespace 2>"
Conclusion
The open-source OAM (Operation and Maintenance) tools Prometheus, Grafana, and Alert Manager can benefit 5G Telecom operators. Prometheus periodically captures all the status of monitored 5G Telecom network functions through the HTTP protocol, and any component can be connected to the monitoring as long as the 5G Telecom operator provides the corresponding HTTP interface. Prometheus and Grafana Agent gives the 5G Telecom operator control over the metrics the operator wants to report; once the data is in Grafana, it can be stored in a Grafana database as extra data redundancy.
In conclusion, Prometheus allows 5G Telecom operators to improve their operations and offer better customer service. Adopting a unified monitoring and alert system like Prometheus is one way to achieve this.
Opinions expressed by DZone contributors are their own.
Comments