A Guide to Regression Analysis Forecasting in Python
Python's statsmodels and sklearn libraries are widely used to develop the forecasting models based on Regression Analysis.
Join the DZone community and get the full member experience.
Join For FreeRegression analysis is a technic of estimating the value of a dependent variable based on the values of independent values. These models largely explore the possibilities of studying the impact of independent variables on dependent variables.
In this article, we will focus on estimating the value of revenue (dependent variable) based on the historical demand (independent values) coming from various demand channels like Call, Chat, and Web inquiries. I will use Python libraries like statsmodels and sklearn to develop an algorithm to forecast revenue.
Once we can predict the revenue, this empowers the businesses to strategies the investment, and prioritize the customers and demand channels with an aim to grow the revenue.
Data Ingestion and Exploration
In this section, I will detail the test data, data ingestion using pandas, and data exploration to get familiar with the data. I am using a summarized demand gen dataset, containing the following data attributes.
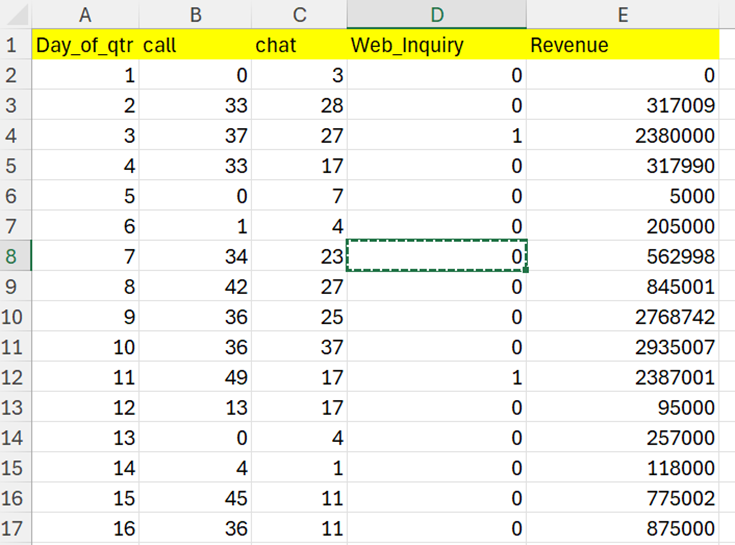
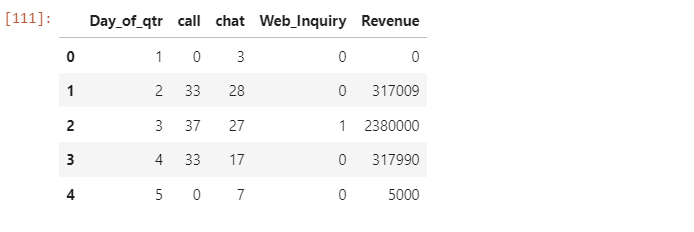
The following code block would ingest the input file “DemandGenRevenue.csv” and list the sample records.
import numpy as np
import pandas as pd
import seaborn as sns
import matplotlib.pyplot as plt
import os
import statsmodels.formula.api as sm
from sklearn.linear_model import LinearRegression, Ridge, Lasso, ElasticNet
from sklearn.metrics import mean_squared_error, r2_score
from sklearn.model_selection import train_test_split
from sklearn.model_selection import cross_val_score
from sklearn.model_selection import GridSearchCV
import warnings

warnings.simplefilter(action='ignore', category=FutureWarning)

df = pd.read_csv("DemandGenRevenue.csv")
df.head()
df.columns
df.info()
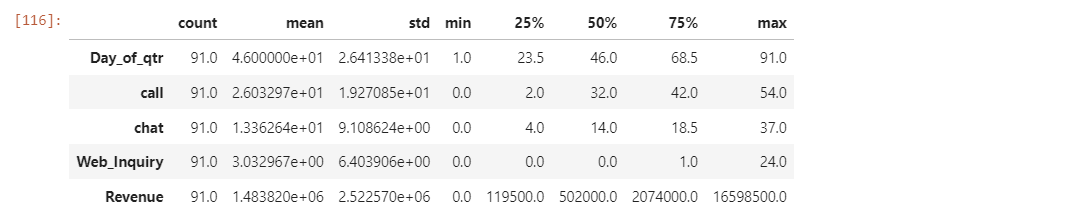
df.describe().T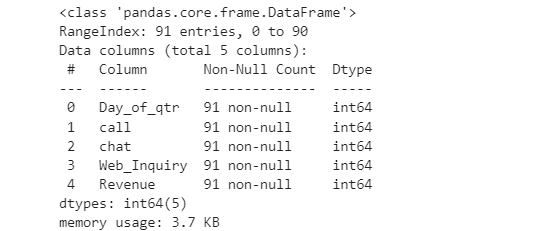
The following code can be used to design Scatter plots to explore the linearity assumption between the independent variables — Call, Chat, Web Inquiry, and the dependent variable — Revenue.
sns.pairplot(df, x_vars=["call", "chat", "Web_Inquiry"], y_vars="Revenue", kind="reg")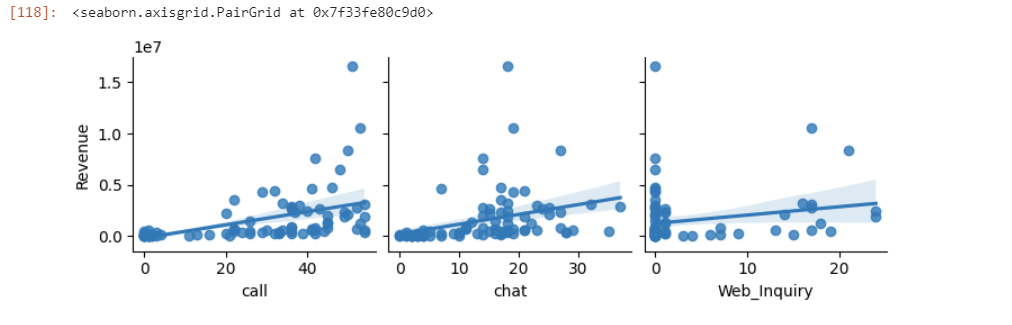
Let's explore the normality assumption of the dependent variable — Revenue using Histograms.
df.hist(bins=20)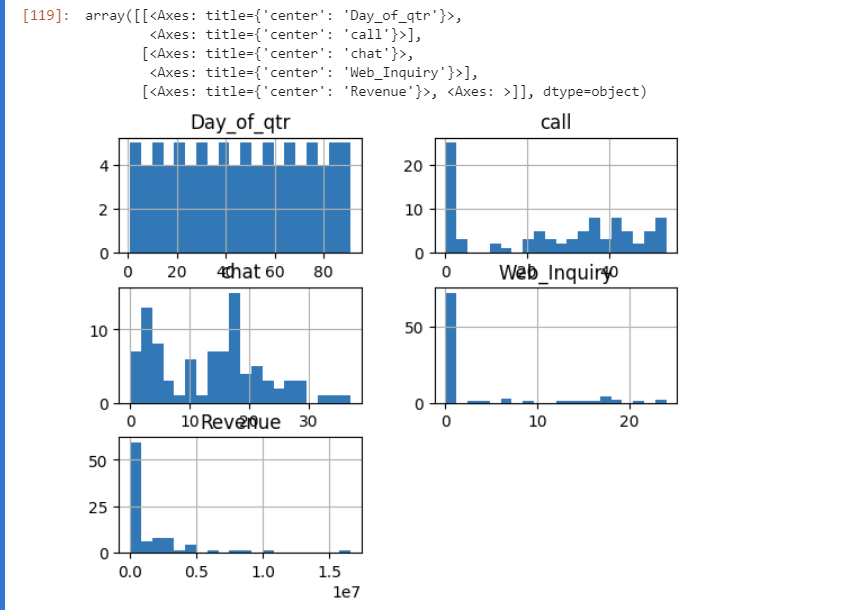
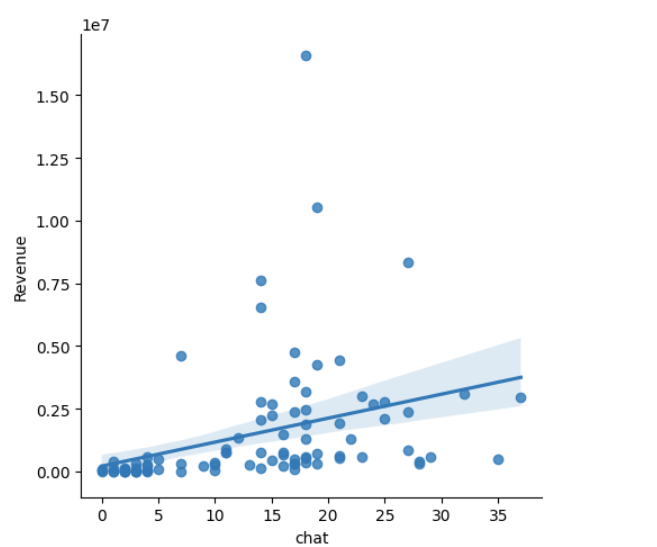
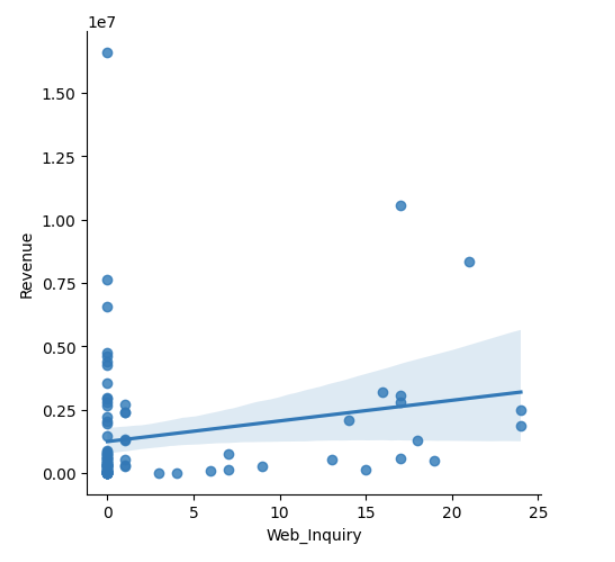
Before we start working on the model, let's explore the relationship between each independent variable and the dependent variable using Linear regression plots.
sns.lmplot(x='call', y='Revenue', data=df)
sns.lmplot(x='chat', y='Revenue', data=df)
sns.lmplot(x='Web_Inquiry', y='Revenue', data=df)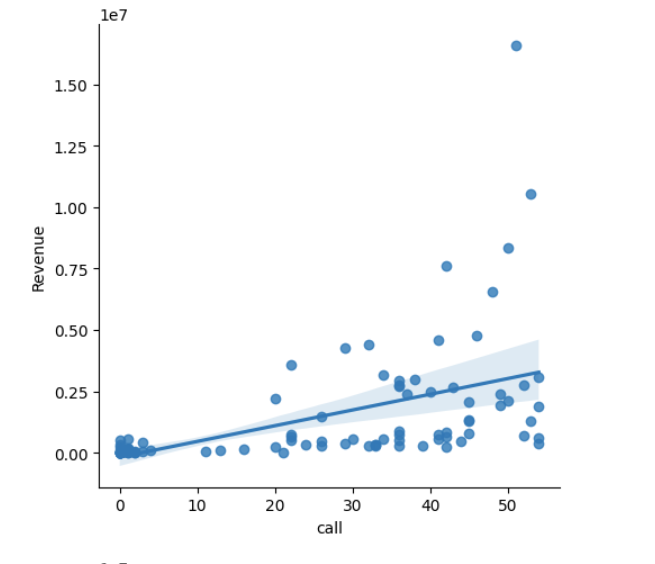
Forecasting Model
In this section, I will delve into the model preparation using statsmodels and sklearn libraries. We will build a linear regression model based on the demand coming from calls, chats, and web inquiries.
X = df.drop('Revenue', axis=1)
y = df[["Revenue"]]

X_train, X_test, y_train, y_test = train_test_split(X, y, test_size=0.20, random_state=46)
The following code will build a Linear regression model to forecast the revenue.
lin_model = sm.ols(formula="Revenue ~ call + chat + Web_Inquiry", data=df).fit()
print(lin_model.params, "\n")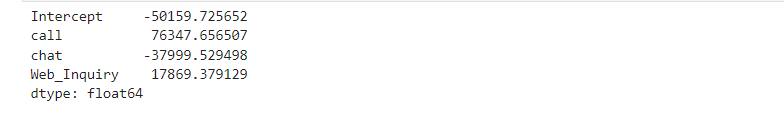
Use the below code to explore the coefficients of the linear model.
print(lin_model.summary())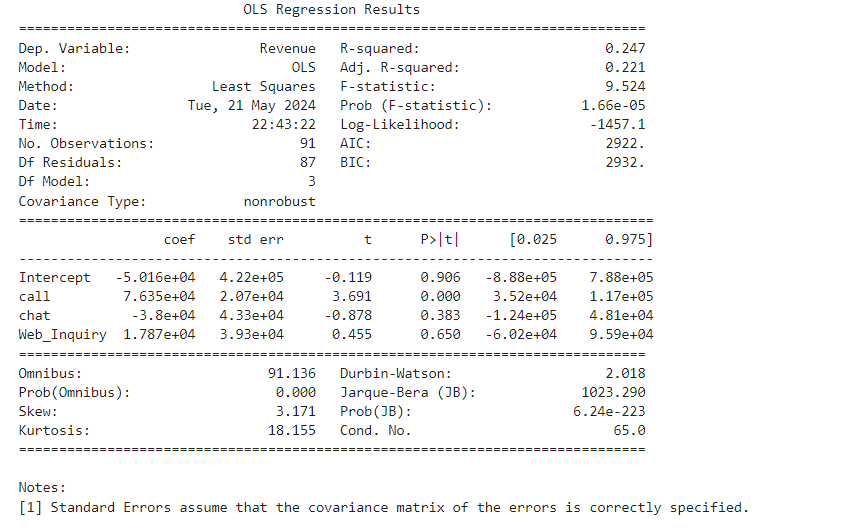
The code below can be used to define various models and loop through the models to forecast, for simplicity's sake, we will only focus on the Linear Regression Model.
results = []
names = []
models = [('LinearRegression', LinearRegression())]

for name, model in models:
    model.fit(X_train, y_train)
    y_pred = model.predict(X_test)
    result = np.sqrt(mean_squared_error(y_test, y_pred))
    results.append(result)
    names.append(name)
    msg = "%s: %f" % (name, result)
    print(msg)
Now that we have the model ready, let's try and forecast the revenue based on the input. If we were to get 1000 calls, 650 chats, and 725 Web Inquiries, based on the historical data we can expect $64.5M of revenue.
new_data = pd.DataFrame({'call': [1000], 'chat': [650], 'Web_Inquiry': [725]})
Forecasted_Revenue = lin_model.predict(new_data)
print("Forecasted Revenue:", int(Forecasted_Revenue))
The code below provides another set of inputs to test the model, if the demand center receives 2000 calls, 1200 chats, and 250 web inquiries, the model forecasts the revenue at $111.5M of revenue.
new_data = pd.DataFrame({'call': [2000], 'chat': [1200], 'Web_Inquiry': [250]})
Forecasted_Revenue = lin_model.predict(new_data)
print("Forecasted Revenue:", int(Forecasted_Revenue))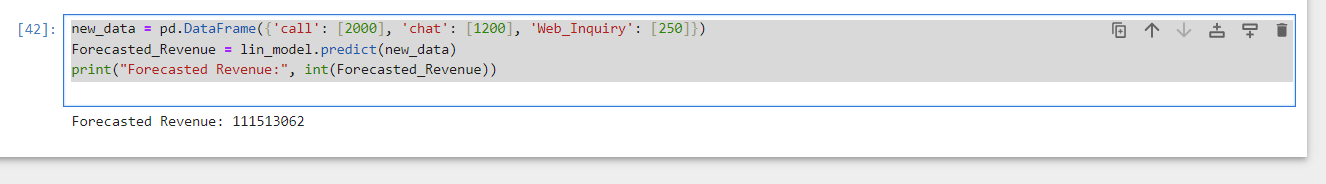
Conclusion
In the end, Python offers multiple libraries to implement the forecasting, statsmodels and sklearn lays a solid foundation for implementing a linear regression model to predict the outcomes based on historical data. I would suggest continued Python exploration for working on enterprise-wide sales and marketing data to analyze historical trends and execute models to predict future sales and revenue. Darts is another Python library I would recommend implementing time series-based anomaly detection and user-friendly forecasting based on models like ARIMA to deep neural networks.
Opinions expressed by DZone contributors are their own.
Comments