Transforming Proprietary Trace Context to W3C Trace Context
GCP/AWS proprietary trace context to W3C standard trace context for out-of-the-box OpenTelemetry integration to support distributed tracing.
Join the DZone community and get the full member experience.
Join For FreeMicroservices-based architecture splits applications into multiple independent deployable services, where each service provides a unique functionality. Every architectural style has pros and cons. One of the challenges of micro-service architecture is complex debugging/troubleshooting.
Distributed Tracing
In a microservice world, distributed tracing is the key to faster troubleshooting. Distributed tracing enables engineers to track a request through the mesh of services and therefore help them troubleshoot a problem.
To achieve this, a unique identifier, say, trace-id, is injected right at the initiation point of a request, which is usually an HTTP load balancer. As the request hops through the different components (third-party apps, service-mesh, etc.), the same trace-id should be recorded at every component. This essentially requires propagation of the trace-id from one hop to another.
Over a period, different vendors adopted different mechanisms to define the unique identifier (trace-id), for example:
- Zipkin B3 headers
- Datadog tracing headers
- Google proprietary trace context
- AWS proprietary trace context
- Envoy request id
- W3C trace context
An application can adopt one of these available solutions as per the need. Accordingly, the relevant header (e.g., x-cloud-trace-context if Google proprietary trace context is adopted) should get injected at the request initiation and thereafter same value should get propagated to each of the components involved in the request lifecycle to achieve distributed tracing.
W3C Trace Context Standard
As the microservice world is evolving, there is a need to have a standard mechanism for trace propagation. Consider the case when two different applications that adopted two different trace propagation approaches, are used together. Since they use two different headers for trace propagation, distributed tracing gets broken when they communicate.
To address such problems, it is recommended to use the W3C trace context across all components. W3C trace context is the standard that is being adopted by all major vendors for supporting cross-vendor distributed traces.
Problem: Broken Traces
OpenTelemetry supports the W3C trace context header "traceparent" propagation using auto-instrumentation. This means, as an application developer, I need not write any code in my application for trace context propagation when I instrument it with OpenTelemetry. For example, if I have a Java application, I can instrument it as shown below:
java -javaagent:opentelemetry-javaagent.jar -Dotel.service.name=app-name -jar app.jar
The traceparent header will now be automatically generated/propagated by the instrumented Java application.
However, when my application, instrumented using OpenTelemetry, gets deployed behind GCP or AWS HTTP load balancer, my expectation to visualize the complete trace starting from the load balancer fails. This is because
- GCP HTTP Load Balancer supports their proprietary trace context header "X-Cloud-Trace-Context". See GCP documentation for more details.
- AWS Elastic Load Balancer supports their proprietary trace context header "X-Amzn-Trace-Id". See AWS documentation for more details.
- My application generates and logs the W3C traceparent header.
So, the unique-identifier generated by the GCP/AWS load balancer is not propagated further by my application. This is the typical problem of broken traces, also described above.
So how can a developer leverage the out-of-the-box OpenTelemetry trace context propagation functionality?
Solution: GCP Trace Context Transformer
We have solved this problem by transforming the GCP/AWS proprietary trace context header (X-Cloud-Trace-Context/ X-Amzn-Trace-Id) to the W3C trace context header (traceparent).
Service mesh is a key component in a distributed system to enforce organization policies consistently across all the applications. One of the popular service mesh, Istio, can help in solving our problem. The diagram below elaborates on the solution:
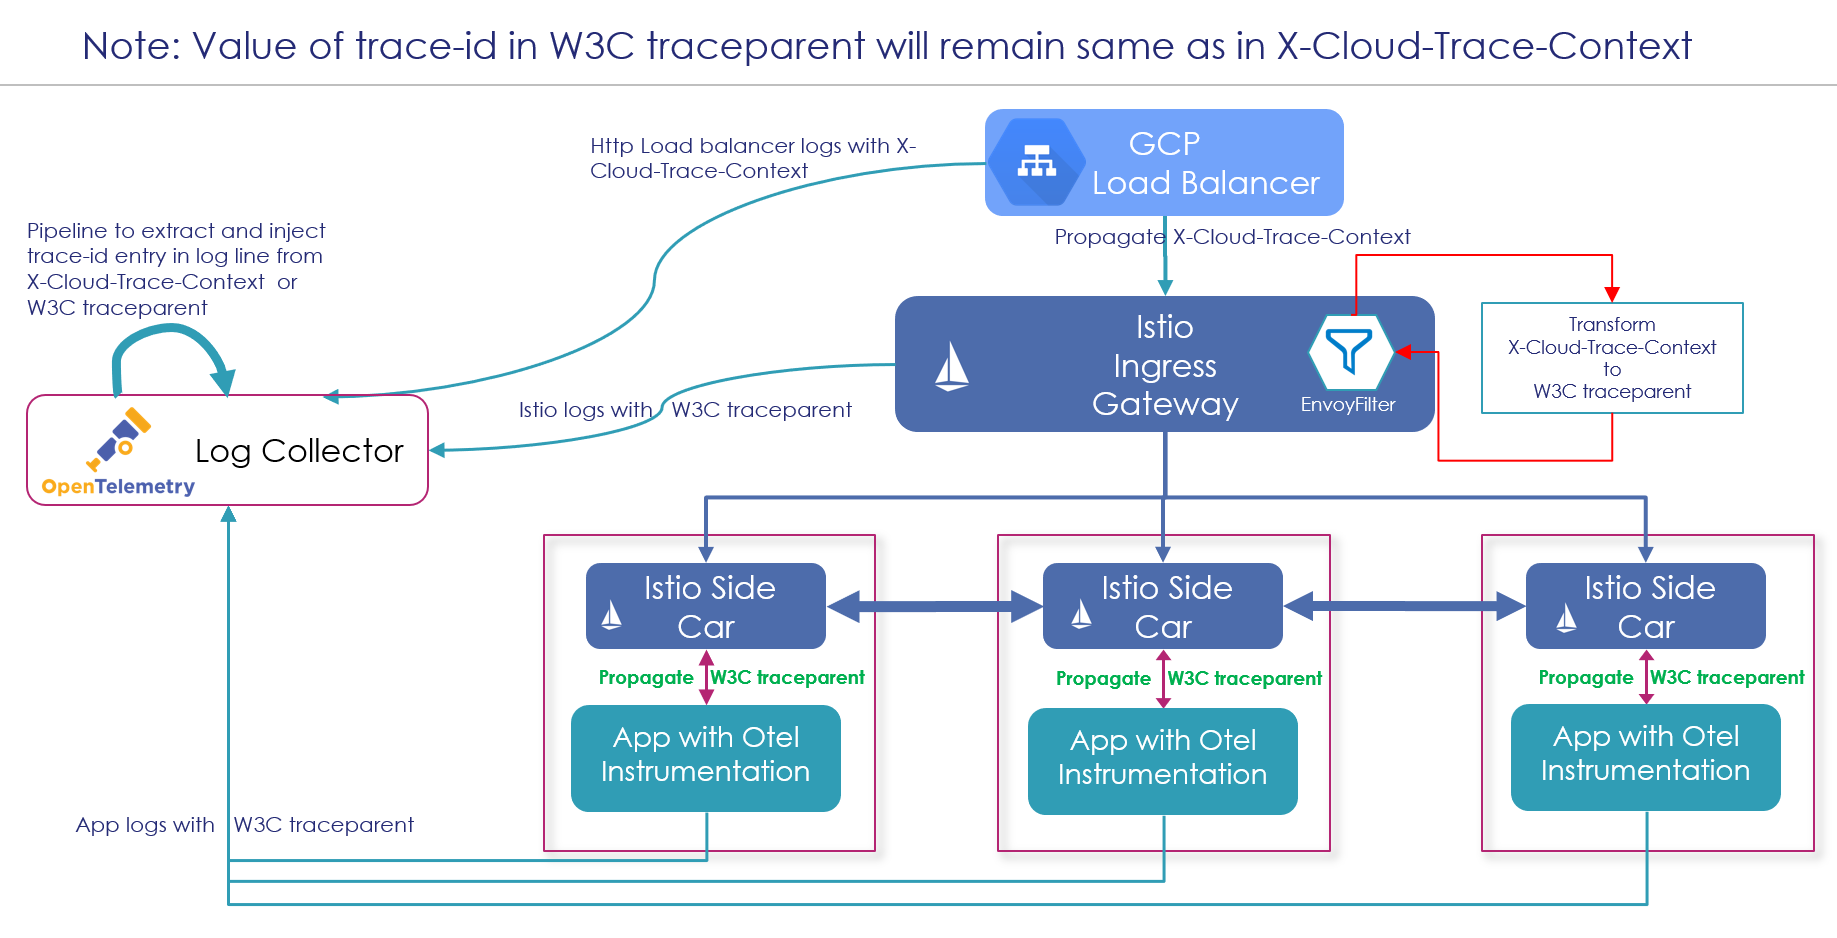
A common Trace-Id value across all the logs generated from the load balancer, istio-ingress gateway, istio-sidecar, and application logs helps in stitching all the logs for a request processing.
Istio allows you to extend the data-plane behavior by writing custom logic using either Lua or WASM.
We have extended the istio-ingress gateway by injecting a Lua filter. This filter extracts the trace-id and span-id from X-Cloud-Trace-Context and creates the traceparent request header using these values.
Note:
- For the sake of simplicity, below filter code is built only for the GCP "X-Cloud-Trace-Context". One can write a similar filter for AWS "X-Amzn-Trace-Id".
- While adopting the filter in your infrastructure, don't forget to choose the right namespace and workloadSelector label.
- This filter has been tested on Istio 1.20.1 version.
apiVersion: networking.istio.io/v1alpha3
kind: EnvoyFilter
metadata:
  name: gcp-trace-context-transformer-gateway
  namespace: istio-system
spec:
  workloadSelector:
    labels:
      istio: ingressgateway
  configPatches:
  - applyTo: HTTP_FILTER # http connection manager is a filter in Envoy
    match:
      context: GATEWAY
    patch:
      operation: INSERT_BEFORE
      value:
       name: envoy.filters.http.lua
       typed_config:
          "@type": "type.googleapis.com/envoy.extensions.filters.http.lua.v3.Lua"
          inlineCode: |
            function envoy_on_request(request_handle)

              local z = request_handle:headers():get("traceparent")
              if z ~= nil then
                return
              end

              local x = request_handle:headers():get("X-Cloud-Trace-Context")
              if x == nil then
                return
              end

              local y = string.gmatch(x, "%x+")
              local traceid = y()
              if (traceid == nil) then
                return
              end

              -- generate a new 16 hex-character random span
              math.randomseed(os.time())
              local parentid = math.random(0xffffffff, 0x7fffffffffffffff)
              local traceparent = string.format("00-%s-%016x-01", traceid, parentid)
              request_handle:headers():add("traceparent", traceparent)

            end

            function envoy_on_response(response_handle)
              return
            end
Alternate Solution: Custom GCP Trace Context Propagator
Another possible solution could be extending OpenTelemetry to support the propagation of GCP proprietary trace context. One implementation exists on GitHub but, alas, it is still in alpha state (at the time of publishing this article). Further, this solution will only work for GCP environments, similar propagators will be needed for different cloud providers (AWS, etc).
Opinions expressed by DZone contributors are their own.
Comments